Keepa charts are an indispensable tool for any serious Amazon seller. They help understand product prices and sales history, monitor pricing trends, track the Buy Box, and supply tons of other valuable product data.
For Amazon sellers involved in online arbitrage, wholesale, and other types of Amazon sales, it is vital to know how to read Keepa charts to choose profitable products to sell on Amazon.
Keep reading to learn how to read Keepa charts and use them in Amazon product research.
What Are Keepa Charts?
Keepa is an Amazon price tracking tool that tracks product data on Amazon, displaying it in easy-to-read charts. These charts include information on price history, sales rank, Buy Box statistics, and much more.
Keepa allows tracking price fluctuations of products, monitoring sales rank trends, and estimating how quickly a product sells. It also contains a lot of data about the product sales history, reviews and ratings, and other essential information helping sellers figure out if a product is worth reselling. Keepa charts are available for most products in the Amazon catalog.
By visualizing this data, Keppa helps Amazon sellers make smarter, more informed decisions when they select products for reselling. Charts assist in refining product research and maximizing profits through smart data usage.
What Are Keepa Charts Used For?
Keepa charts offer crucial insights into product data that help Amazon sellers in their product research. These charts display price history, sales rank, and other key metrics, allowing sellers to make data-driven decisions and stay competitive in the marketplace.
Price tracking
One of the most valuable features of Keepa is its ability to track historical price changes for any product. Keepa charts provide a detailed history of a product’s price changes over time. Sellers use this data to identify pricing trends, decide when to buy or restock inventory, and set competitive prices.
Key use cases
- Analyze price trends over time;
- Identify the best times to buy or restock inventory based on price drops;
- Set price alerts for when products reach a desired price point.
Sales Rank monitoring
Sales rank data shows how well a product is selling relative to others. By tracking fluctuations in sales rank, sellers can gauge demand, track how well a product is selling over time, and spot seasonal trends.
Key use cases
- Help sellers gauge product demand and popularity;
- Take decisions on which products to buy based on sales;
- Provide insights into product seasonality.
Buy Box tracking
The Buy Box is the featured offer on an Amazon product page, and winning it is key to boosting sales. Keepa charts help sellers monitor Buy Box price changes and adjust their strategies to increase the chances of winning it more often.
Key use cases
- Understanding Buy Box statistics;
- What pricing strategies competitors are using;
- Whether changes in price or fulfillment method (FBA vs. FBM ) influence Buy Box performance.
Competitor analysis
Keepa charts track the number of competitors selling the same product. Sellers can use this information to gauge market saturation, identify pricing opportunities, and strategize on how to stand out from competitors.
Key use cases
- Identifying number of competitors offering the same product;
- Spotting opportunities when competitors run out of stock;
- Planning competitive pricing strategies.
Amazon stock monitoring
Keepa can show when Amazon itself runs out of stock on a product, giving third-party sellers a chance to raise prices and capture more sales. This allows sellers to capitalize on temporary gaps in Amazon’s availability.
Key use cases
- Determine which products are sold by Amazon directly;
- See when Amazon is stocking or selling out of a product;
- Increase prices strategically when Amazon runs out of stock.
FBA and FBM trends
Keepa provides insights into whether products are being fulfilled by Amazon (FBA) or by merchants (FBM). Sellers can use this data to estimate competition levels and decide which fulfillment method might be more profitable for their specific products.
Key use cases
- Which fulfillment method might be more profitable;
- How switching to FBA or FBM affects the Buy Box win rate and sales;
- Whether to adjust pricing depending on fulfillment trends.
What Are the Keepa Chart Elements?
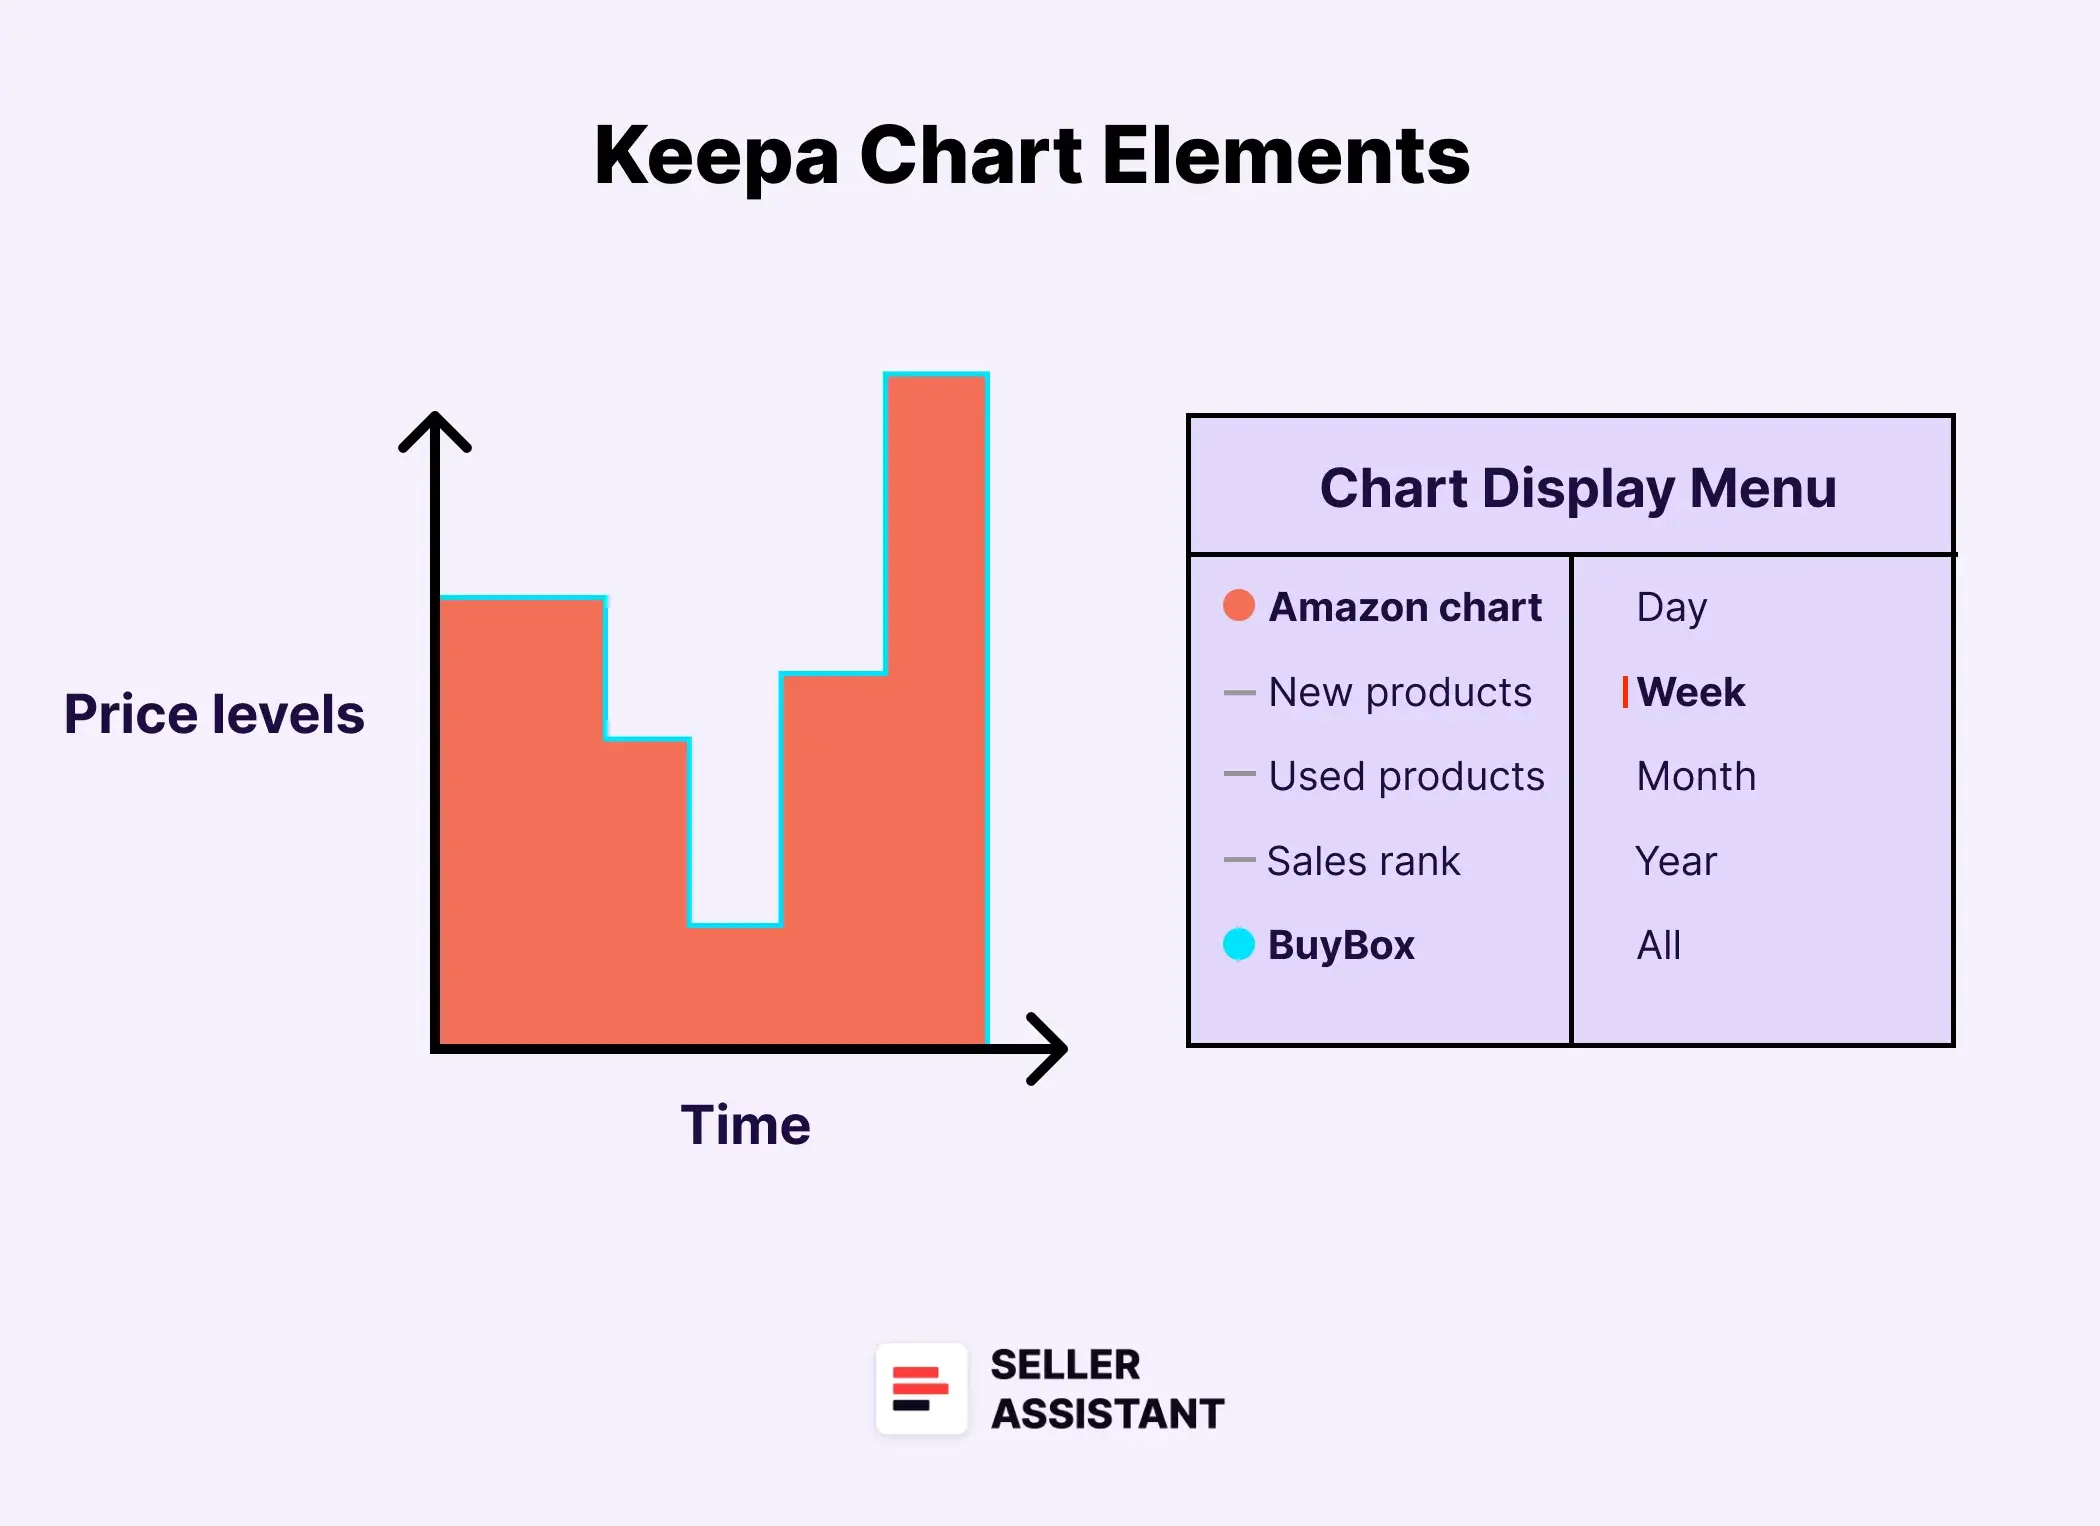
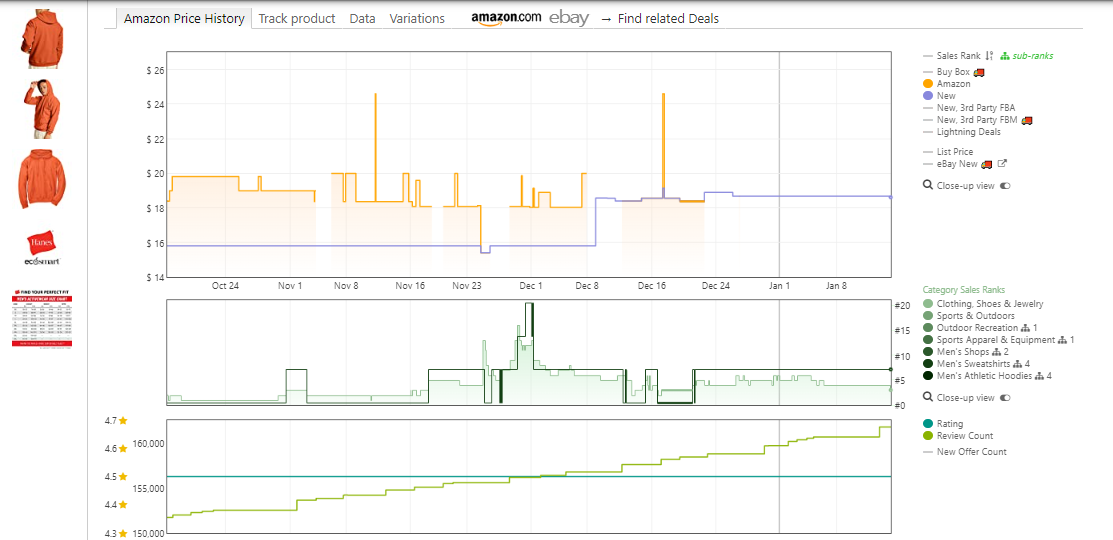
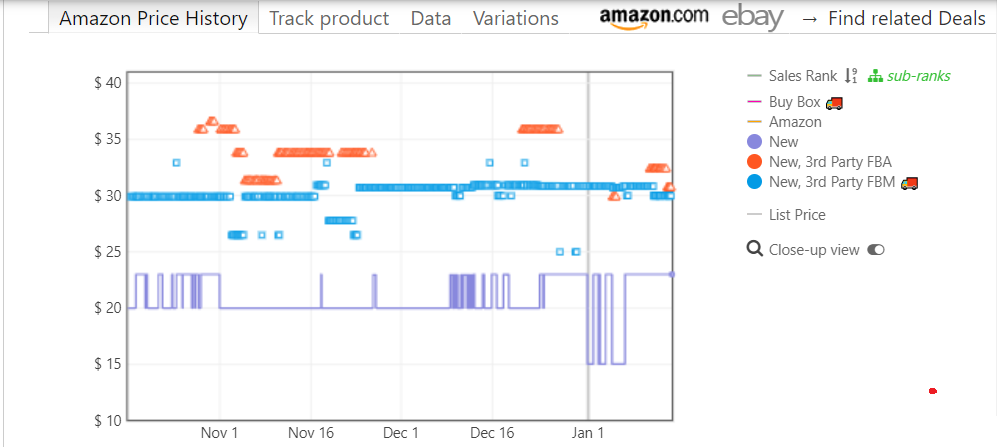
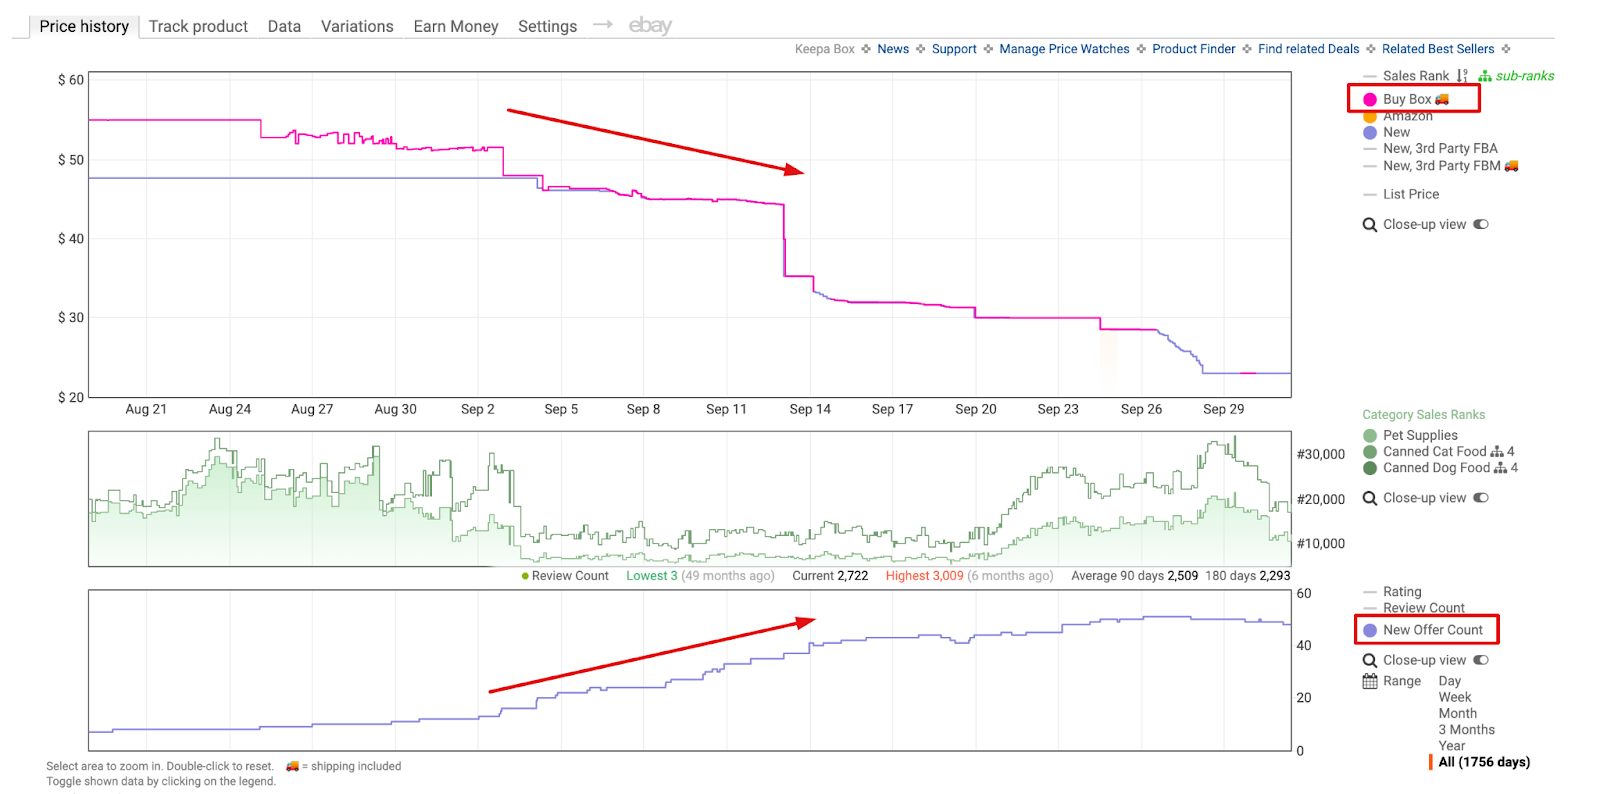
Keepa chart shows product price history. The left-hand side of the chart shows the price levels. At the bottom, it indicates the dates. The right-hand side displays the sales rank figures.
To the right of the chart, you can see the menu that lets you customize your view. You can select to display only the Amazon chart, New or Used products, Sales Rank, or Buy Box.
Additionally, you can set a period to view the data — day, week, month, 3 months, year, or all.
Keepa chart Color Key
- Orange shaded area shows Amazon as a seller;
- Purple line shows Marketplace New (the lowest product offer in the New condition from a 3rd-party seller or Amazon);
- Black shows Marketplace Used (the lowest product offer in the Used condition from a 3rd-party seller or Amazon);
- Green shows Sales Rank;
- Pink line and diamonds shows the Buy Box;
- The orange triangle shows New 3rd-party FBA (the lowest FBA seller product offer in the New condition);
- Blue square shows New 3rd-party FBM (the lowest FBM seller product offer in the New condition).
- The yellow gold line is product unit sales/month.
What Does Keepa Chart Show?
Keepa charts provide a wide range of data that helps Amazon sellers analyze product performance and sales history. Below you can find the key Keepa chart elements description and the explanation how to interpret them in your product research.
Amazon in stock
Keepa shows if the product is sold by Amazon, not as a marketplace, but as a seller, and how long Amazon sells it. The chart displays Amazon’s price offer.
The orange shaded area shows Amazon is in stock. If you see the white area between orange slots, that means Amazon was out of stock during that time.
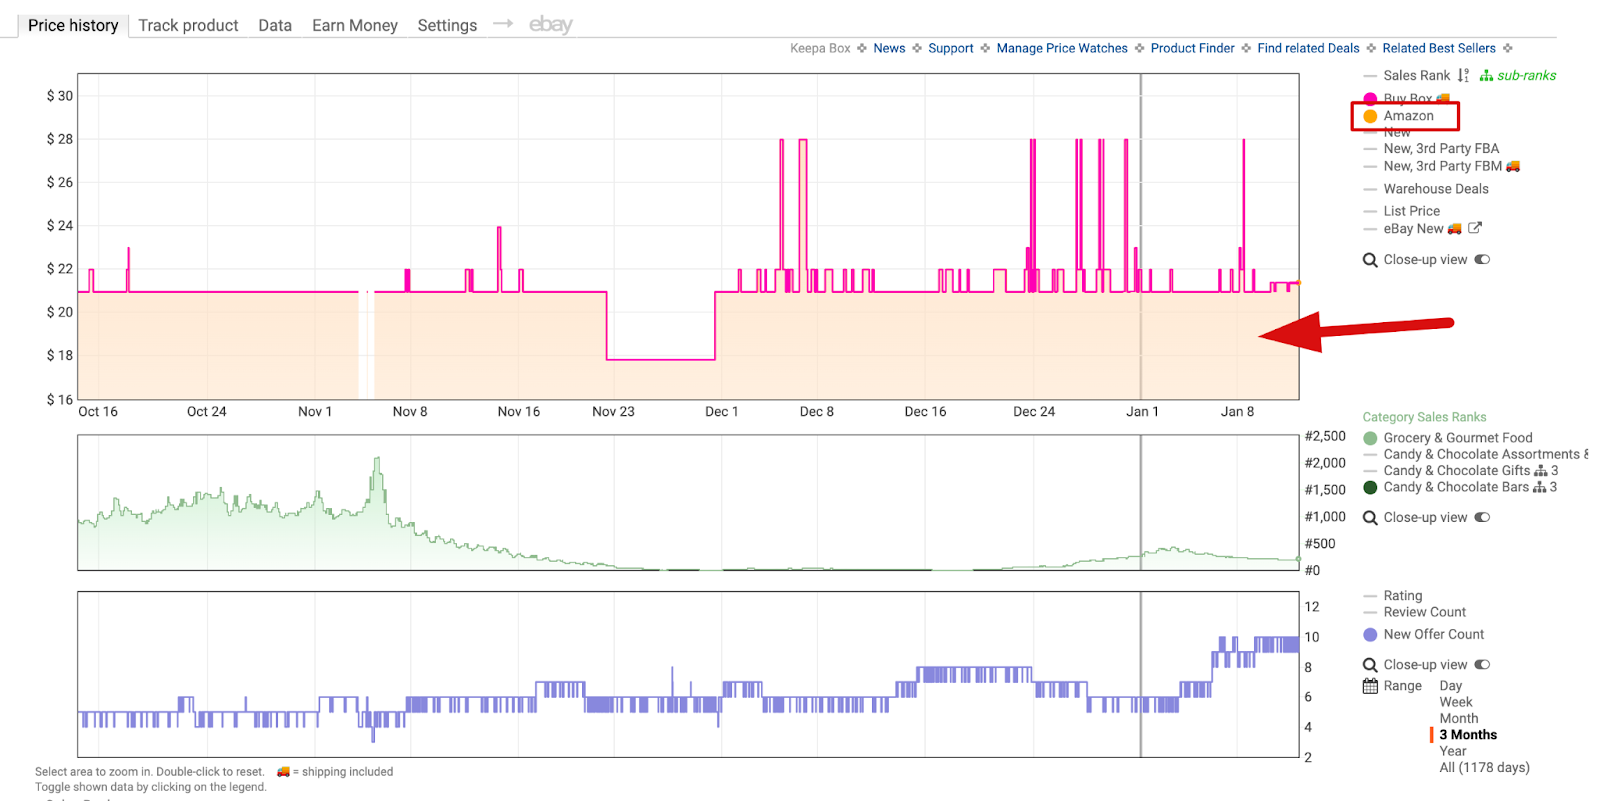
Interpretation
If Amazon is in the listing as a seller, it’s tough to compete with them. The internet giant has the most favorable conditions from the suppliers and can afford to offer a lower price. Also, they are reluctant to give away Buy Box to 3rd-party sellers.
For that reason, Amazon in the listing is a red flag for sellers who prefer to avoid competing with it. Products sold by Amazon are not suitable for inexperienced sellers as well.
Related: 13 Rules of OA Product Research Tested by Pain and Gain of Amazon Seller
New and Used Price
The ’New’ purple line shows the lowest product offer in the New condition from a 3rd-party seller at any given time (the figure indicates the offer price, not the product’s sale price).
The ’Used’ black line shows the lowest product offer in the Used condition from a 3rd-party seller. That is also the offer price, not the product’s sale price.
Interpretation
The lowest product price offer gives the picture of the minimum current price level, helps set a price, and better estimate potential profit.
When you set your own price, remember that the lowest price doesn’t mean the optimal one. If you significantly cut your price, that can hurt your profit margin. Usually, when creating the offer, FBA sellers consider other FBA sellers’ pricing, while FBM sellers look at FBM offers.
However, if you want to consider the lowest-priced offer as an FBA seller, you must remember that it may come from an FBM merchant and not include shipping fees. In such a case, shipping costs must be added on top of the price.
If you deal with product research, the Used parameter is optional.
Private label seller listing
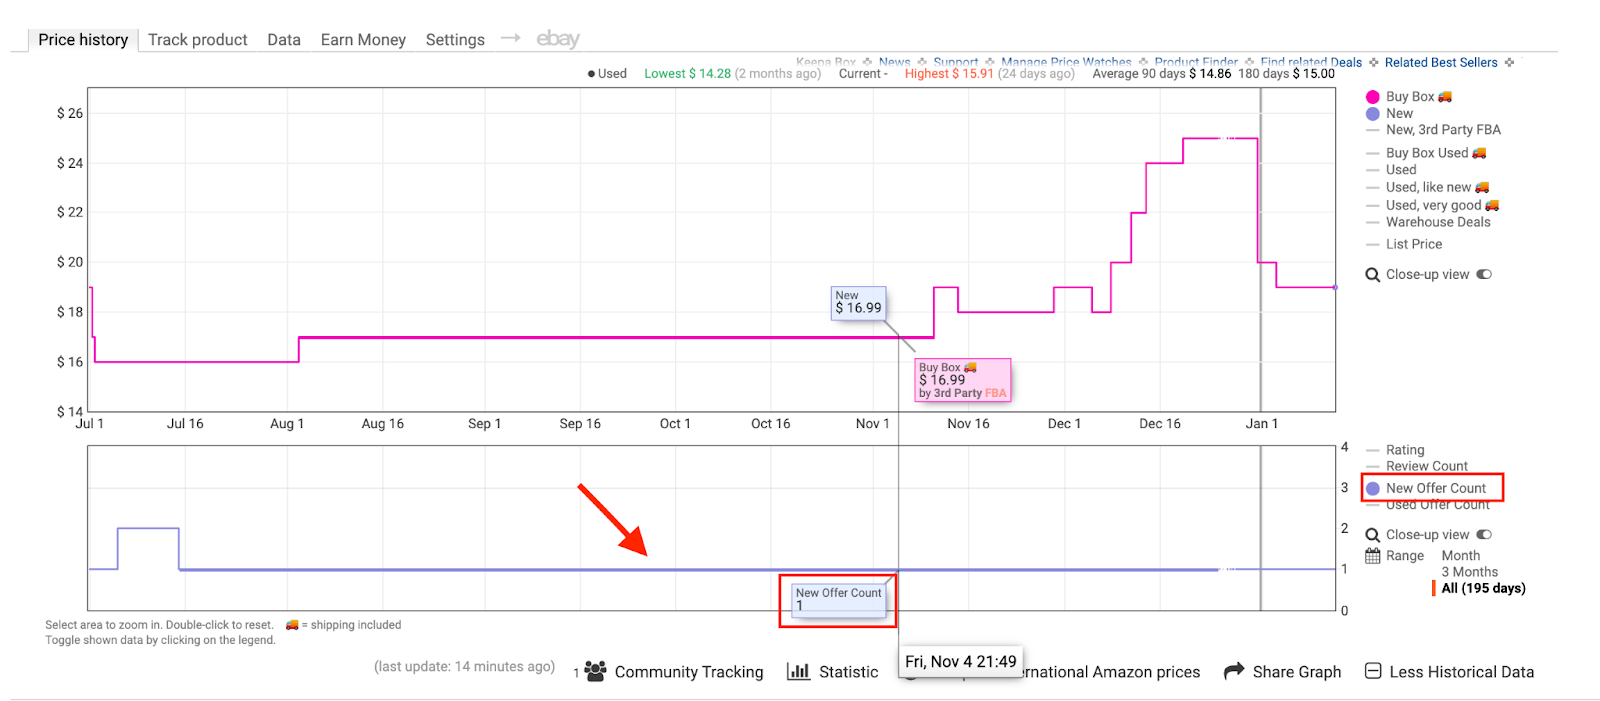
From a Keepa chart, you can understand if a product is sold by a private label (PL) merchant. Private label is a trademarked item for which only one seller holds all rights. Amazon resellers can’t sell such products.
Interpretation
From a chart, you can see that a product is PL. The items with a single seller in the listing are usually PL, while products that are not PL usually have multiple sellers. In the example below, the product is sold by one merchant during 195 days, which means it’s a PL product.
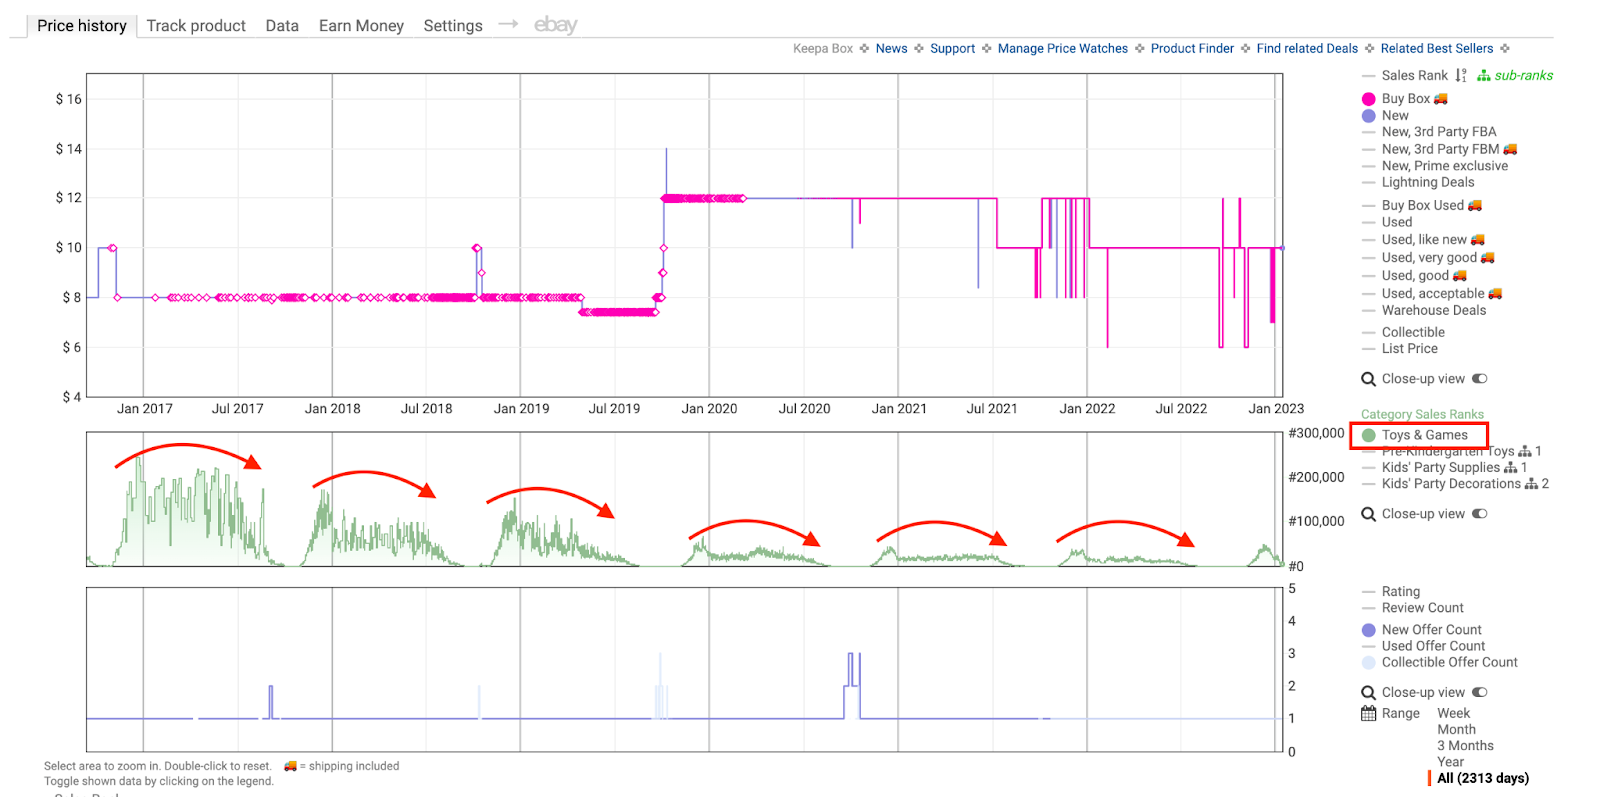
Sales Rank
The right-hand side of the chart displays the sales rank figures, and the green line shows rank history.
Interpretation
Sales Rank (BSR) helps estimate how well the product sells. Amazon doesn’t show how much the product sells. It shows how the product sells compared to other items in the category.
However, the sales rank indirectly indicates sales levels. The lower the rank, the better the product sells. Because sales rank changes, you must analyze the average figure and the trend — upwards or downwards — to see if product sales increase or decrease.
Also, if, during specific time periods, a product’s rank goes down to zero, that may indicate a seasonal product. Such products only sell within a particular season, not throughout the year (e.g., summer or winter shoes).
Suppose the Keepa chart shows that the rank goes down to zero in the high season and after seasonal sales start to increase, that may indicate a seasonal product. When doing product research, online arbitrage sellers must remember that such products do not sell all year round.
Related: Amazon Best Sellers Rank – Everything You Need to Know
Buy Box
Keepa displays a Buy Box as a pink line. A pink diamond appears when it spots a change in the Buy Box. To see details, hover your mouse over a mark.
Interpretation
Around 80% of sales happen in the Buy Box. Therefore, it’s crucial to win the Buy Box. The number of sellers fighting for the Buy Box and how they share it indicates the level of competition. It helps estimate your potential sales and profit in a specific deal. Identifying if Amazon is in the Buy Box is also essential. That is because if Amazon is a seller, it’s challenging to compete.
Also, you must look into the Buy Box dynamics — it shouldn’t drop or fluctuate too much. If it does, that means you won’t be able to sell a product at a stable price, and you must consider the average Buy Box price. When the number of sellers grows, the Buy Box price can drop because the sellers engage in a price war. That means price dumping and low margins.
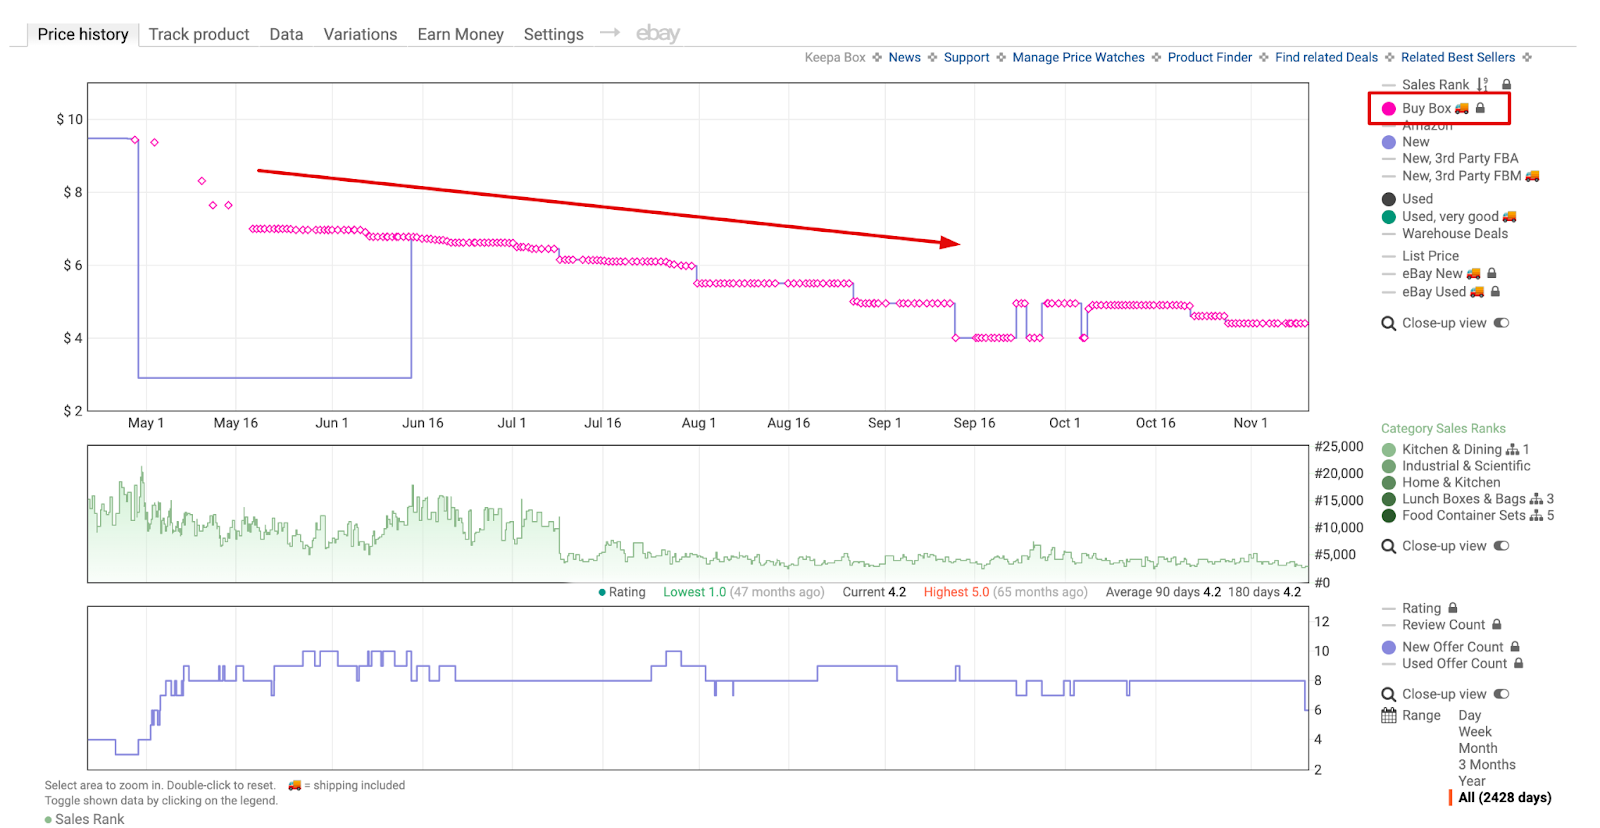
Adversely, when the sellers leave the listing, the Buy Box price can go up.
Related: What is Buy Box? How to win Buy Box on Amazon
New Offer Count
New Offer Count, Review Count, and Ranking are shown in a separate chart at the bottom. New Offer Count figures are displayed on the left-hand side and indicate the number of offers on a listing.
Interpretation
A New Offer Count means other sellers on the listing are trying to sell the same item. Increased competition can show that a product is popular and it’s worth selling. However, if more than 15 merchants sell the item, the competition may be too high.
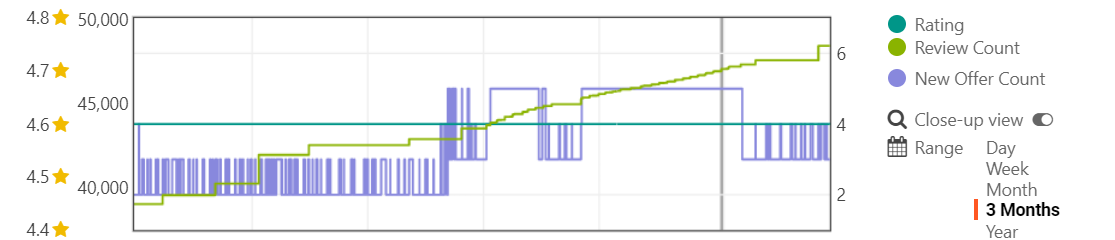
Review Count and Rating
Review Count and Rating figures are displayed on the right-hand side and indicate the number of product reviews and the average number of stars it earned.
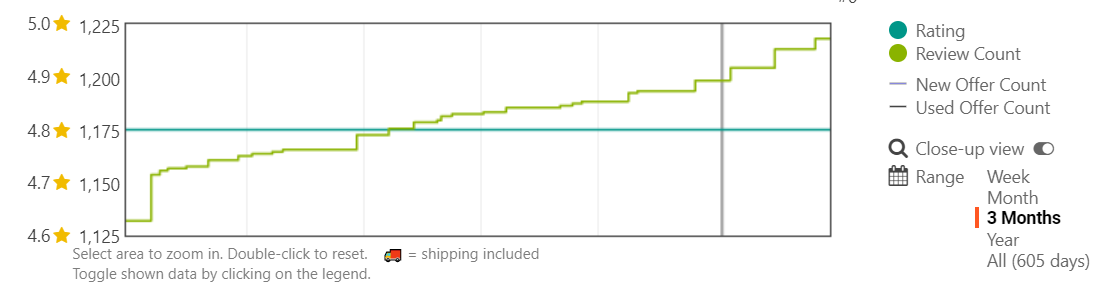
Interpretation
A product with no or bad reviews will likely not sell or generate many returns. Therefore, focusing on products with more than 10 reviews and a rating of 4 stars and up is better.
If you’d like to install Keepa, you can use this link.
Other Keepa Features Overview
In addition to charts, Keepa offers a range of features that are highly valuable for Amazon sellers. Below is a short overview.
Product Finder
The Product Finder allows users to search for products using specific filters, helping them efficiently sort through large volumes of ASINs. It also enables easy export of variation lists and customization of pagination, making high-volume product searches and management more streamlined.
Top Merchants
This feature helps sellers identify top-performing competitors and analyze their strategies. By understanding how these merchants achieve success, users can improve their own seller ranking and increase their chances of winning the Buy Box.
Price Drop Deals
Keepa sends instant alerts when prices drop on specific products. Sellers can set thresholds and apply filters to receive notifications about cost-saving opportunities, allowing them to act quickly on deals and optimize their purchasing strategy.
Category Tree Browsing
This feature lets users explore products by category, helping them enhance product visibility and improve their chances of winning the Buy Box by optimizing placement and targeting specific categories.
View Amazon Best-Selling Products
Keepa provides data on best-selling products, including units sold and inventory levels. Sellers can compare prices across regions, estimate sales rank, and make confident purchasing decisions based on this in-depth analysis.
Price Increase Tracking and Alerts
Sellers can track product price histories and receive alerts when prices rise. This helps them make informed purchasing decisions at the optimal time and stay up-to-date on pricing fluctuations, giving them an edge in managing their inventory effectively.
FAQ
How do you analyze a Keepa graph?
To analyze a Keepa graph, focus on the various lines representing product price, sales rank, and other key metrics over time. By studying these trends, you can identify patterns, such as price drops, sales spikes, and competition levels, to make informed decisions.
What does the green line on this Keepa graph represent?
The green line on a Keepa graph represents the product’s sales rank. It shows how popular the product is in its category, with a lower sales rank indicating higher sales volume.
What does the blue line on this Keepa graph represent?
The blue square shows New 3rd-party FBM (the lowest FBM seller product offer in the New condition). The purple line shows Marketplace New (the lowest product offer in the New condition from a 3rd-party seller or Amazon);
What is the black line in Keepa?
The black line shows the lowest product offer in the Used condition from a 3rd-party seller. It indicates the offer price, not the product’s sale price.
Final Thoughts
Amazon sellers research hundreds of products daily to resell them on Amazon for profit. Keepa helps sellers analyze product sales history by showing detailed product charts and offering a lot of different product data.
However, there are seller tools created explicitly for product research that have additional advanced features and conveniently show you the exact product data where you need it. The right products and great customer service are two essential pillars to succeed on Amazon.
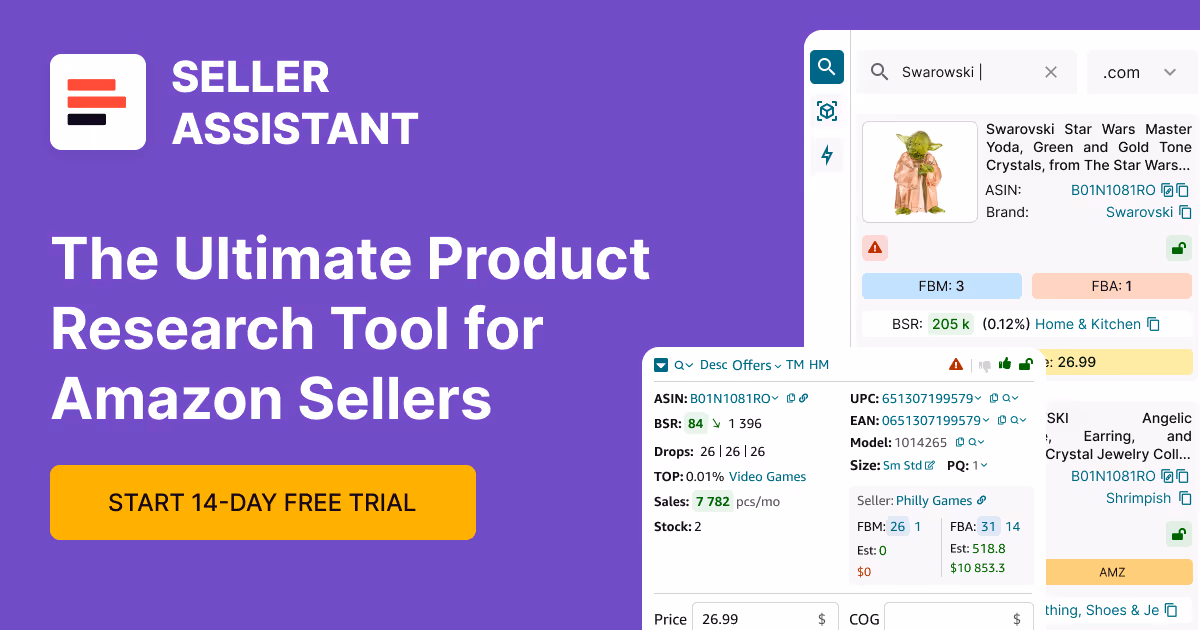
Seller Assistant helps you quickly and conveniently find high-margin products to sell and automates routine product research processes. Seller Assistant is an all-in-one product sourcing software offering all the features vital for product sourcing. It combines three extensions: Seller Assistant Extension, IP Alert, and VPN by Seller Assistant, tools: Price List Analyzer, Brand Analyzer, Seller Spy, Bulk Restrictions Checker, and API integrations, and features: Side Panel View, FBM&FBA Profit Calculator, Quick View, ASIN Grabber, UPC/EAN to ASIN converter, Stock Checker, and other features that help quickly find high-profit deals. Seller Assistant also offers integration with Zapier allowing to create custom product sourcing workflows.