

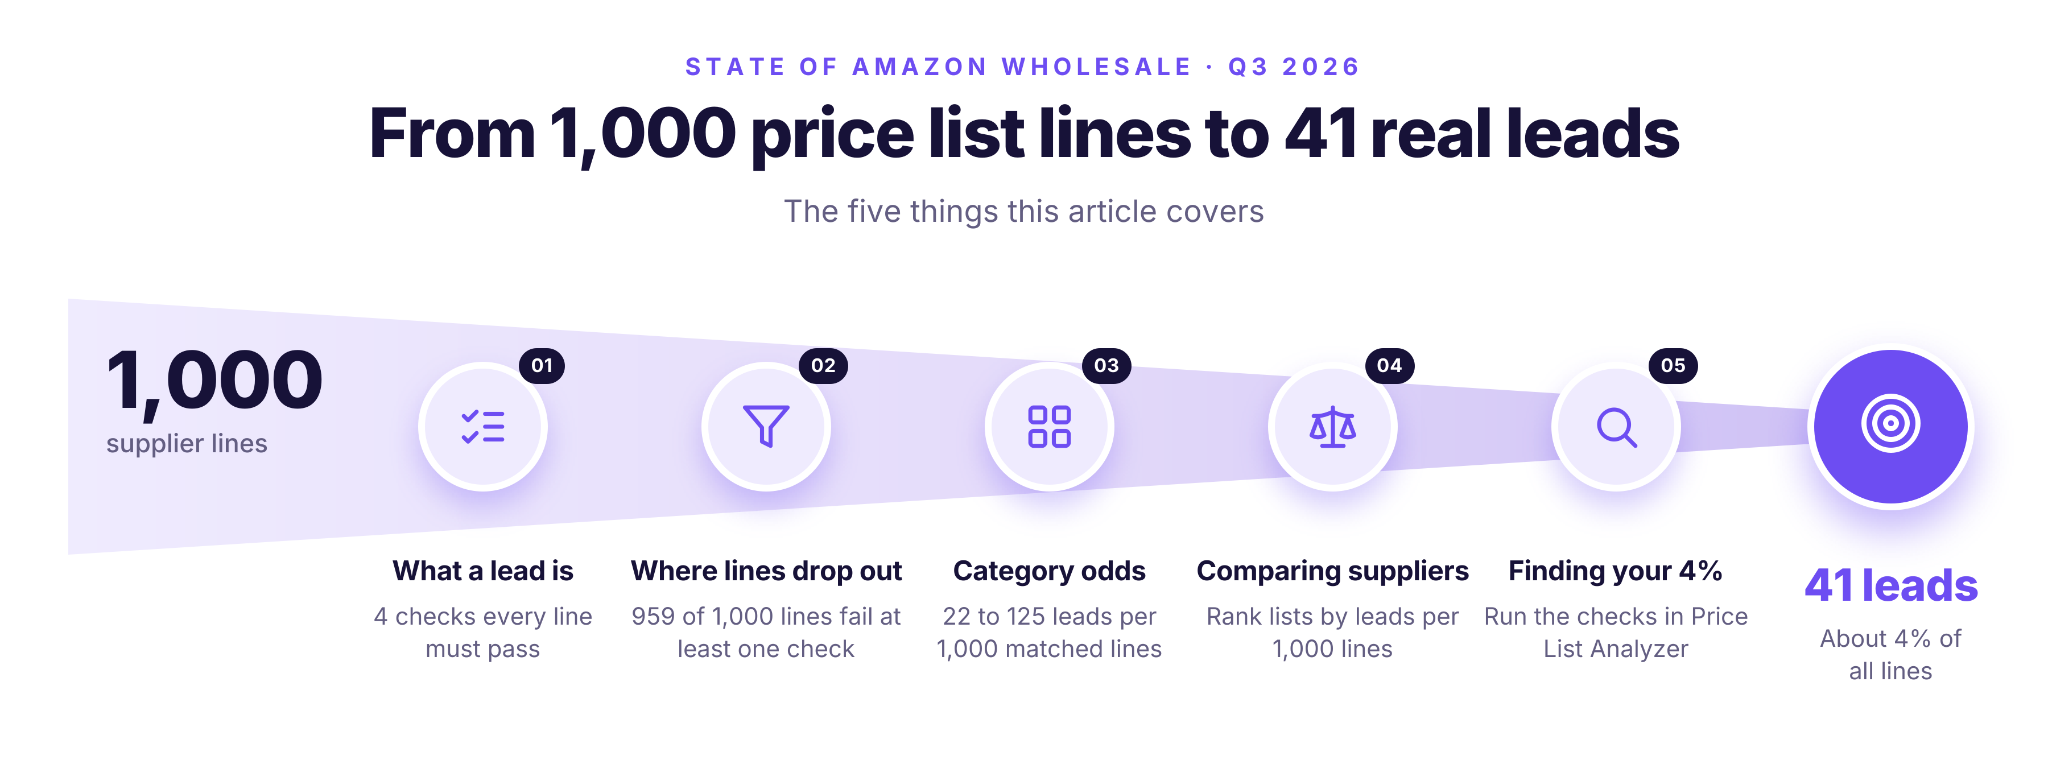
How many products in a price list are profitable? About 15%, but only 41 of every 1,000 supplier lines are real Amazon leads, according to Seller Assistant’s State of Amazon Wholesale (Q3 2026).
About the Data
- Source
Seller Assistant, State of Amazon Wholesale (Q3 2026).
- Sample
The research covers 13.5 million supplier price list lines analyzed by 782 verified Amazon wholesale sellers. The headline sourcing funnel – about 41 qualified leads per 1,000 lines – is based on 4.6 million lines from 100 recurring sellers.
- Period and marketplace
July 2025–August 2026, Amazon.com (US).
What Counts as a Real Amazon Lead?
A product can look profitable on paper and still be a poor wholesale opportunity. A real Amazon lead needs more than a positive margin. In Seller Assistant’s research, a supplier price list line qualified as a lead only if it passed four checks.
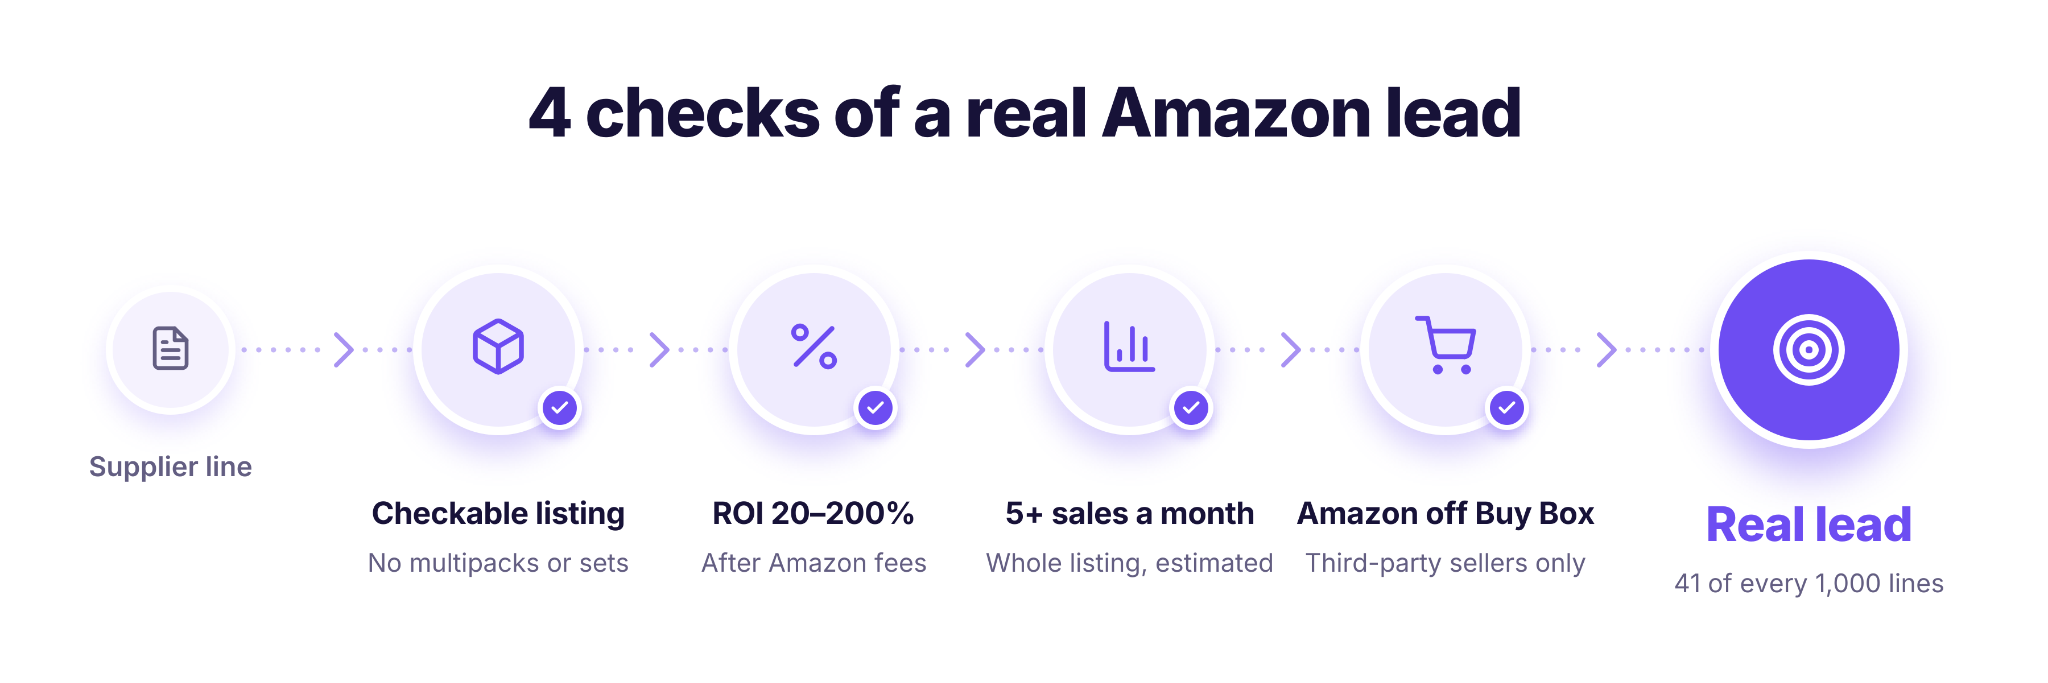
A checkable Amazon listing
The product must match an Amazon listing with enough information to calculate fees and profitability. Multipacks and sets are excluded because their unit quantities make supplier costs and Amazon selling prices hard to compare..
ROI between 20% and 200%
The product must generate an estimated return on investment of at least 20% and no more than 200%, based on the Buy Box price after Amazon fees. ROI above 200% usually points to a mismatched product or incorrect pack quantity that needs verification.
At least five estimated monthly sales
The Amazon listing must have at least five estimated sales per month. This threshold applies to the whole listing. Your own share of those sales will be lower.
The product must have a Buy Box that isn’t held by Amazon. When Amazon controls the Buy Box, third-party sellers win fewer sales, even if the estimated ROI looks attractive.
These checks explain the difference between a profitable product and a qualified wholesale lead. According to Seller Assistant, State of Amazon Wholesale (Q3 2026), only about 41 out of every 1,000 supplier price list lines passed all four checks in the headline sourcing funnel.
Why Do 959 of Every 1,000 Lines Fail?
Most supplier lines never reach the profit question. Out of 1,000 lines, 637 drop out on data alone: no Amazon match, no price to compare, or a listing that can’t be checked. ROI then cuts the rest down to 100, and sales and the Buy Box leave 41.
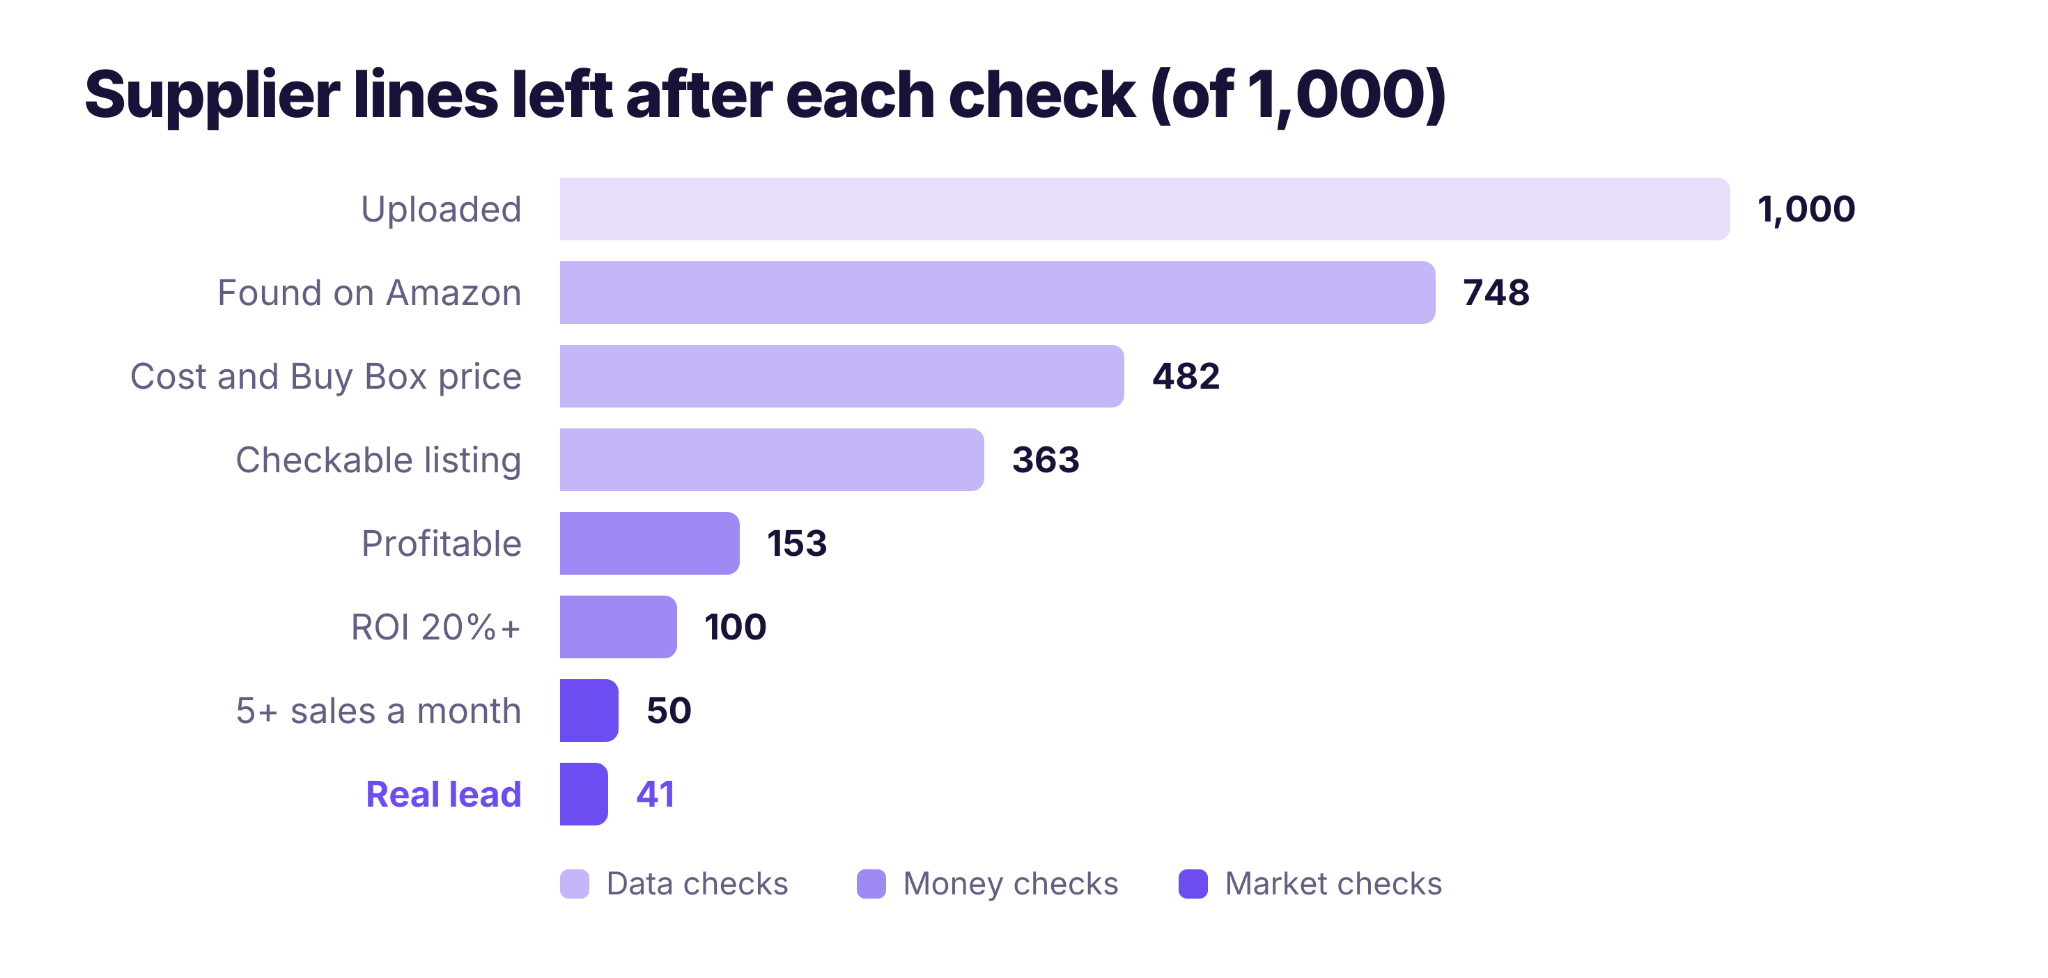
What happens to 1,000 supplier price list lines
| Check | Lines Left | Lines Removed | Why They Drop Out |
|---|---|---|---|
| Supplier lines uploaded | 1,000 | – | Starting point |
| Found on Amazon | 748 | 252 | No matching Amazon listing for the UPC/EAN |
| Cost and Buy Box price | 482 | 266 | Missing cost in the price list or no Buy Box price |
| Checkable listing | 363 | 119 | Fees unknown, multipack listing or set-like title |
| Profitable (ROI 0–200%) | 153 | 210 | Loses money after fees, or ROI above 200% (likely pack or price error) |
| ROI 20% or more | 100 | 53 | Profitable, but margin too thin |
| 5+ sales a month | 50 | 50 | Listing sells fewer than 5 units a month (estimated) |
| Amazon off Buy Box = lead | 41 | 9 | Amazon holds the Buy Box |
Data checks: 637 lines gone before you see a margin
- A quarter of all lines (252 of 1,000) don’t match any Amazon listing.
- Another 266 have a match but are missing a supplier cost or a Buy Box price, so there’s nothing to calculate.
- Then 119 more fall out because the listing can’t be checked fairly. Either Amazon fees aren’t known, or the listing is a multipack or set whose unit count doesn’t match the supplier’s quote.
For a wholesale buyer, this is the part of a price list that costs time and returns nothing.
Money checks: 363 checkable lines become 100
- Only 153 of the 363 checkable lines show a profit between 0% and 200% ROI after referral and FBA fees.
- Another 53 are profitable but stay under 20% ROI, which leaves little room for prep, freight or a price drop.
- A separate 22 lines per 1,000 show ROI above 200%, and these are set aside for checking.
A number that high almost always means a case price matched to a unit price, or a 6-pack listing matched to a single.
Market checks: 100 strong-ROI lines become 41
According to Seller Assistant, State of Amazon Wholesale (Q3 2026), half of supplier lines with 20% ROI or more fail because the Amazon listing sells fewer than 5 units a month.
- Lowering the bar to 1 sale a month only raises the count to 48 leads per 1,000 lines, so these products don’t sell at any threshold.
- The last 9 lines fall out because Amazon itself holds the Buy Box.
- The 5-sale threshold counts sales for the whole listing. If three other sellers are on the same ASIN, your real sales will be lower than the estimate.
Does Your Category Change the Odds?
Yes, but less than it looks. The figures in this section use a different base from the rest of the post: leads per 1,000 matched lines (lines that found an Amazon listing), not per 1,000 uploaded lines. On this basis, the all-category average is 54.5 leads per 1,000.
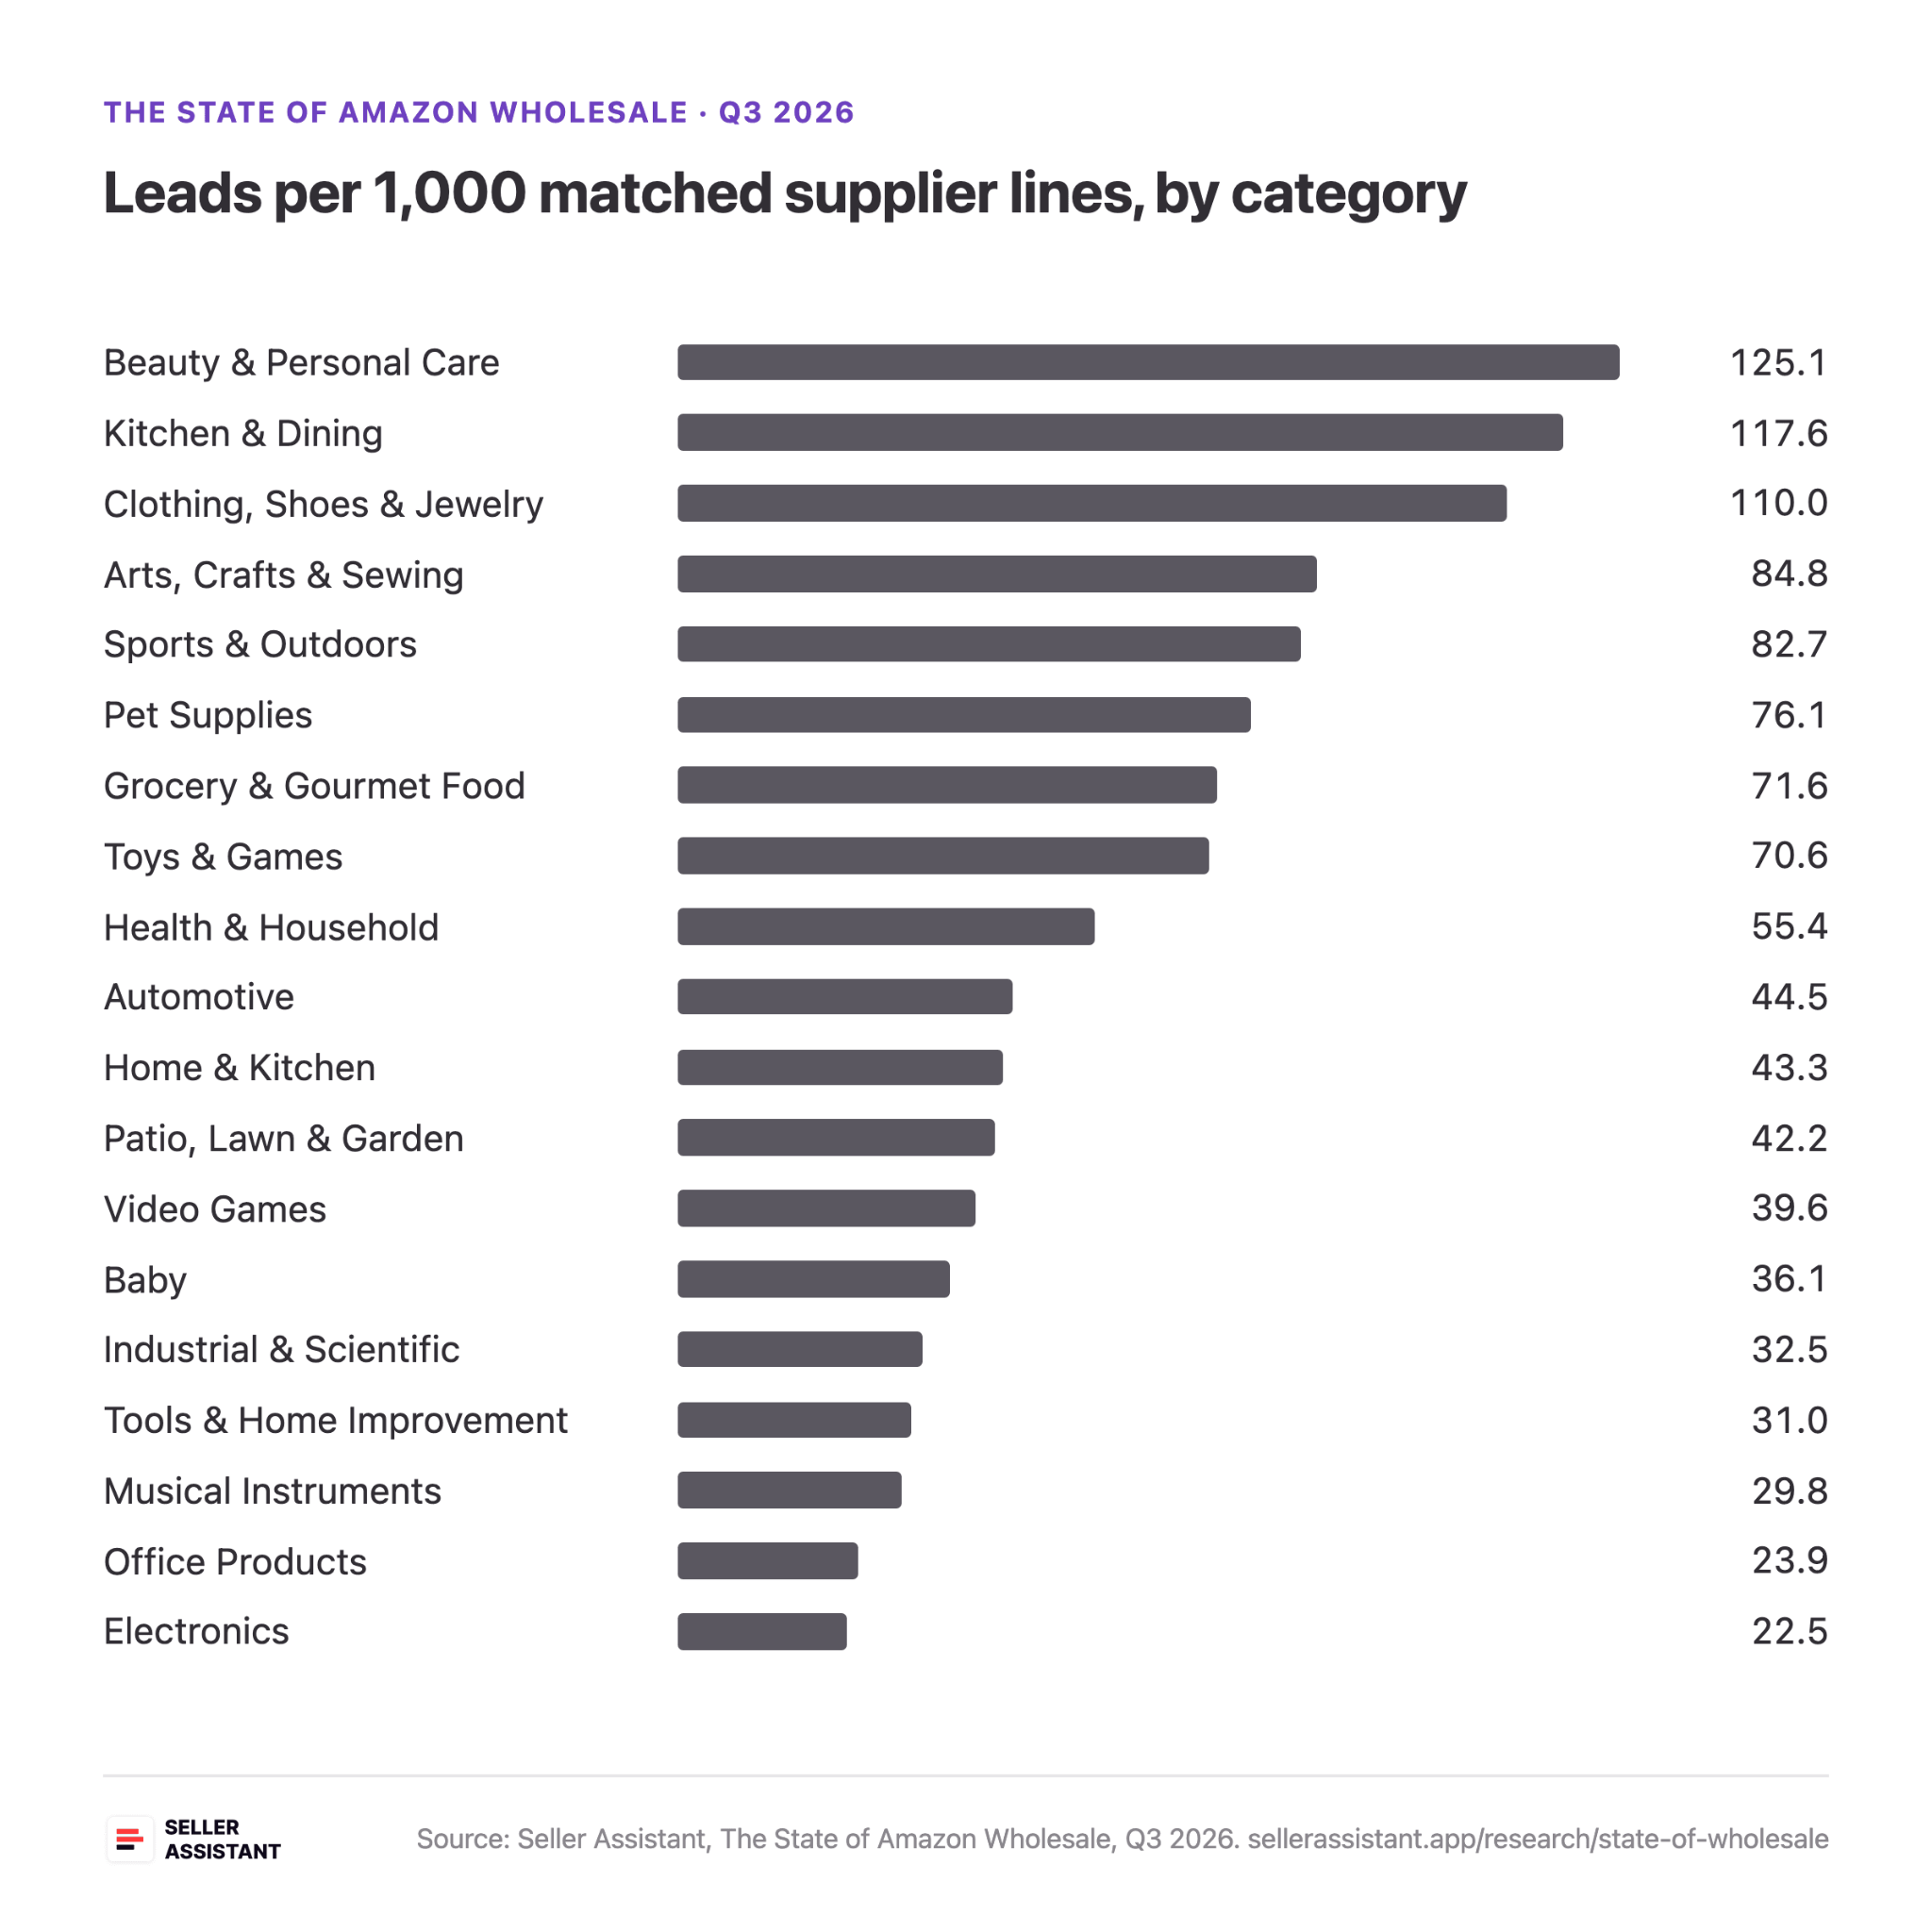
The best and worst categories for leads
Beauty & Personal Care leads with 125 leads per 1,000 matched lines, followed by Kitchen & Dining (118) and Clothing, Shoes & Jewelry (110). At the bottom are Electronics (22.5) and Office Products (24).
Why Home & Kitchen falls below average
Home & Kitchen gets 43 leads per 1,000 matched lines, against 54.5 for all categories. It passes the 20% ROI check more often than average, but it loses more lines in two places. More Home & Kitchen listings fail the 5-sales check. And about 53 of every 1,000 matched lines show ROI above 200%, almost twice the overall rate of 29. These are mostly pack-size and price errors, so check case and unit quantities before you trust a Home & Kitchen deal that looks too good.
Why your screening matters more than your category
Within a single category, the gap between the best and worst sellers is larger than the gap between categories. In Beauty, the median seller finds 93 leads per 1,000 matched lines, below the category average of 125, because a few large catalogs pull the average up. In Tools & Home Improvement, it runs the other way: the median seller finds 45, well above the category’s 31.
Tip
According to Seller Assistant, State of Amazon Wholesale (Q3 2026), how you select products matters more than which category you sell in. So don’t switch categories because of a chart. Improve how you screen the price lists you already get.
Judge Suppliers by Leads per 1,000 Lines, Not List Size
A 10,000-line price list feels like more opportunity than a 2,000-line one. Often it isn’t. What matters is how many of those lines turn into real leads, and how much screening it takes to find them. Leads per 1,000 lines answers both questions with one number.
How lead rate changes the picture
Example:
Take two suppliers (illustrative numbers):
- Supplier A sends 10,000 lines and you find 220 leads. That’s 22 per 1,000, or 45 lines reviewed for every lead.
- Supplier B sends 2,000 lines and you find 110 leads. That’s 55 per 1,000, or 18 lines per lead.
Supplier A gives more leads in total, but Supplier B gives you better products for far less work. B is also the account where better terms would pay off most.
What a normal lead rate looks like
About 40 leads per 1,000 uploaded lines is typical. If a list comes in far below that, look at the data before you look at the products:
- Missing or outdated UPCs mean lines never match an ASIN.
- Blank cost columns mean there’s nothing to calculate.
- Case prices quoted as unit prices create fake 200%+ ROI.
A cleaner file from the same supplier can lift the lead rate without a single new product. Count leads per supplier line, not per Amazon listing. One UPC often matches the single, a 2-pack and a 6-pack, so you only need one good listing per line.
Practical tips to keep the lead rate up over time
Filter on sales before ROI
Half of the lines with 20%+ ROI fail the sales check, so screening for demand first saves the most time.
Scan new catalogs as soon as they arrive
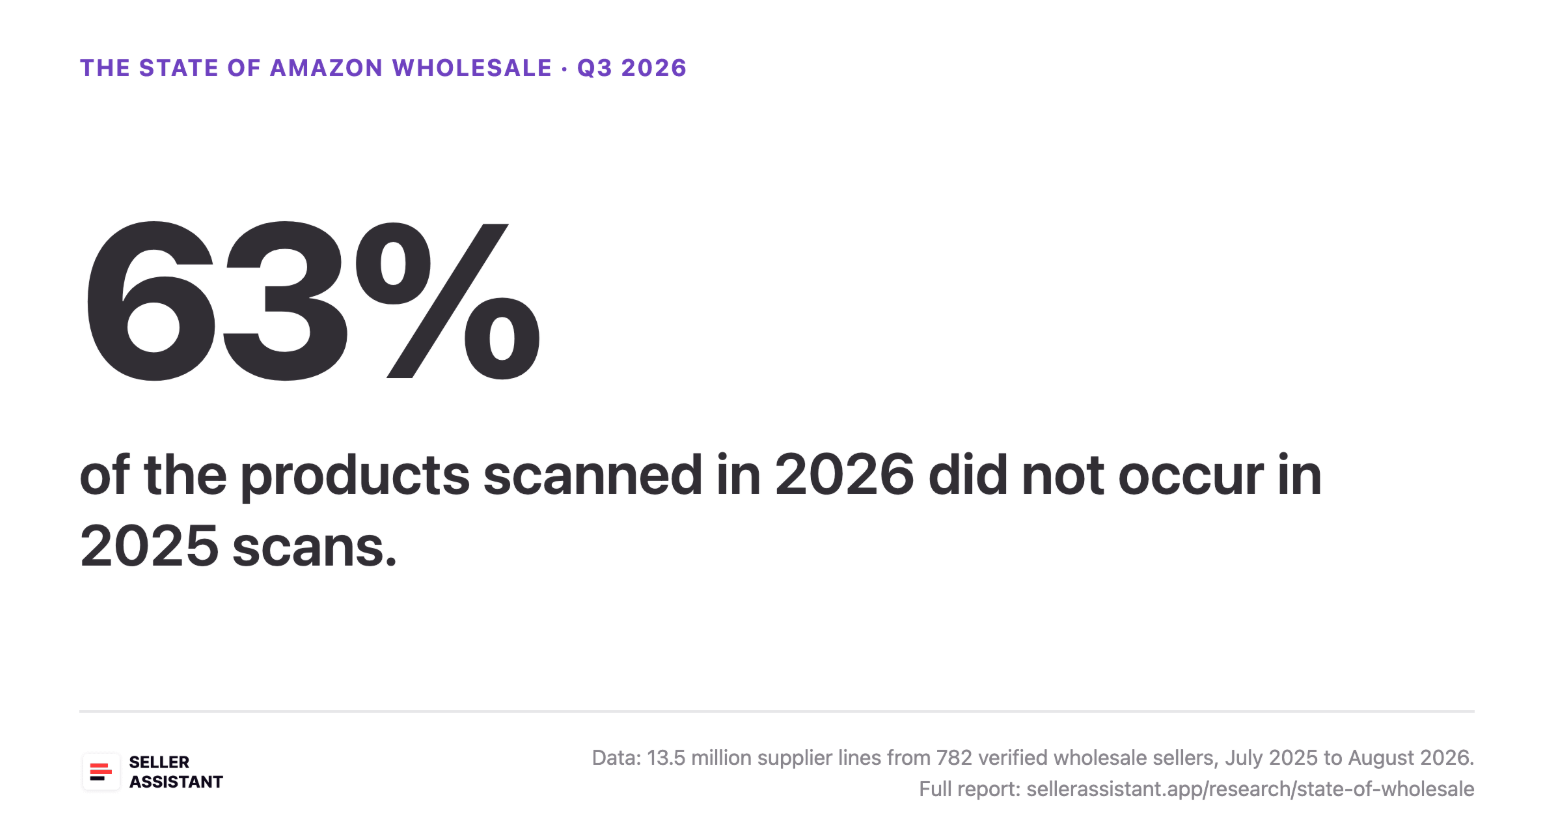
63% of the products scanned in 2026 didn’t appear in 2025 scans. Last year’s results tell you little about this year’s list.
Check the brand before you order
About 3 in 10 products in supplier price lists belong to a brand with a complaint history. A flag isn’t an automatic no, but it’s a reason to look closer before the purchase order. Use Seller Assistant’s Brand Analyzer.
Negotiate before you drop a supplier
A 10% volume discount raises leads by about 29%, because many lines sit just below the 20% ROI threshold.
How Do You Find the 4% in Your Own Price List?
Checking 1,000 lines by hand to find about 40 leads isn’t realistic, so the screening has to be automated. Price List Analyzer is Seller Assistant’s bulk sourcing tool that finds the 4% of supplier price list lines worth buying. Upload a supplier file and it matches each UPC, EAN or ASIN to Amazon listings, calculates fees, profit and ROI, and adds sales, Buy Box and risk data, so you can filter thousands of lines down to real leads in minutes.
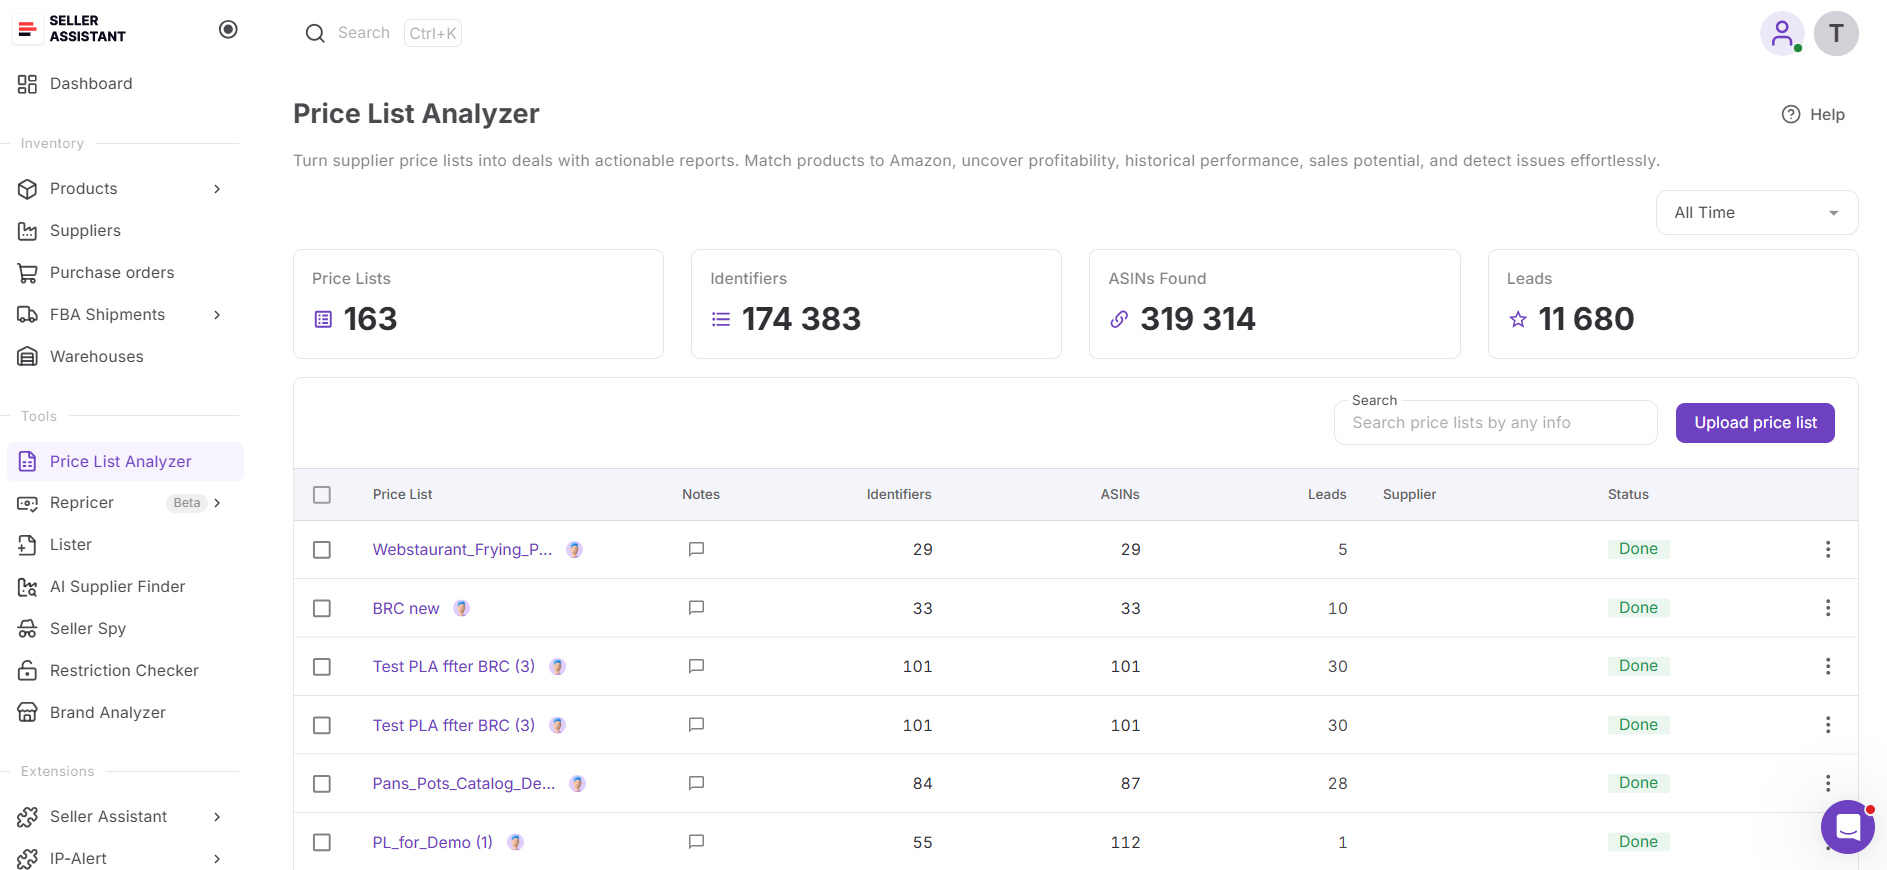
What can you do with Price List Analyzer?
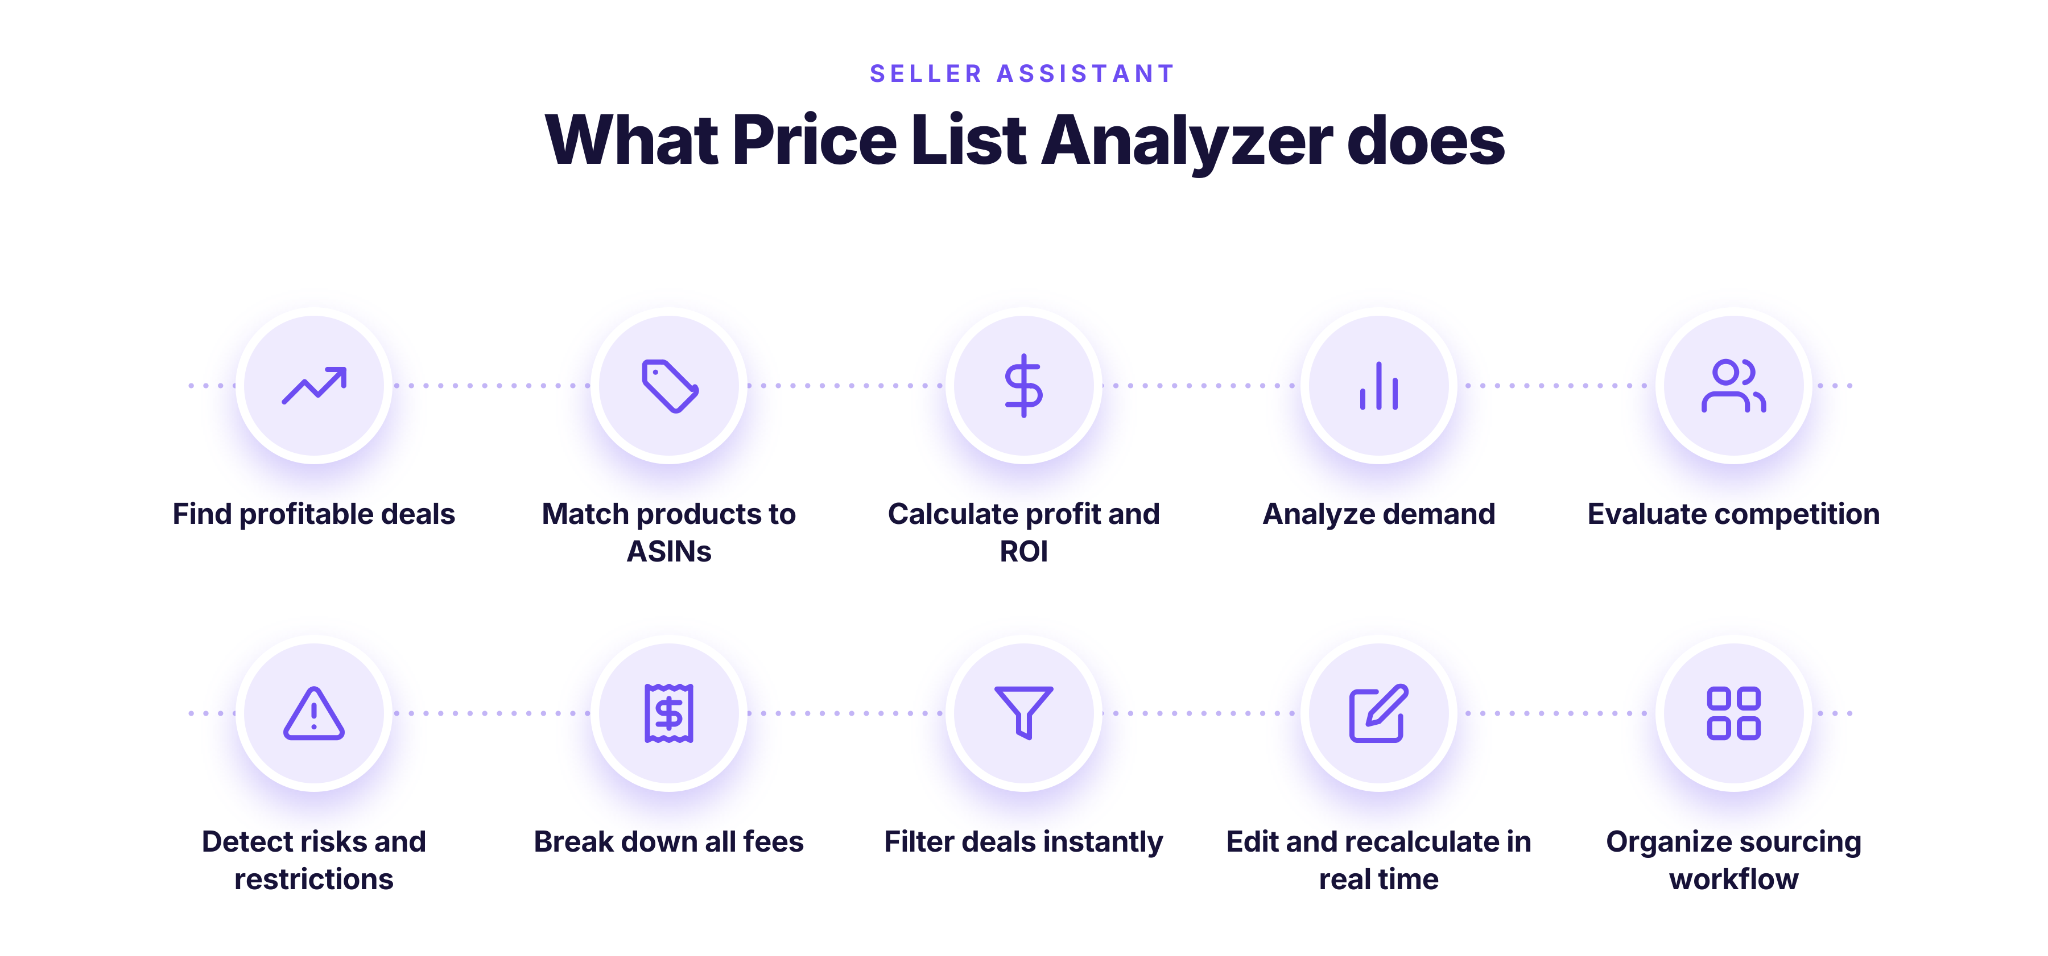
- Analyze entire supplier price lists at once. Check hundreds or thousands of products in a single analysis instead of opening and researching each Amazon listing separately.
- Find matching Amazon ASINs. Automatically identify Amazon listings using supplier product identifiers, saving time on manual product matching.
- Check FBA and FBM profitability. Calculate potential profit, ROI, margin, break-even price, maximum COG, seller proceeds, and costs based on Amazon fees and your sourcing expenses.
- Estimate product demand. Review estimated monthly sales, current and historical Best Sellers Rank (BSR), and Sales Rank Drops to see how consistently products sell.
- Track Buy Box prices and trends. Compare current Buy Box prices with historical averages and pricing changes to identify products whose profitability may depend on temporary price spikes.
- Assess seller competition. See total offers, Buy Box-eligible FBA and FBM sellers, leading competitors, Buy Box share, and whether Amazon competes on the listing.
- Spot restrictions and product risks. Find products flagged for IP-related issues, HazMat, meltable, fragile, or oversize conditions, missing Buy Box information, and other warnings that need checking.
- Filter for products that meet your criteria. Narrow the catalog by ROI, sales, pricing, competition, brand, category, restrictions, and risk indicators. Save filter views to reuse your sourcing criteria.
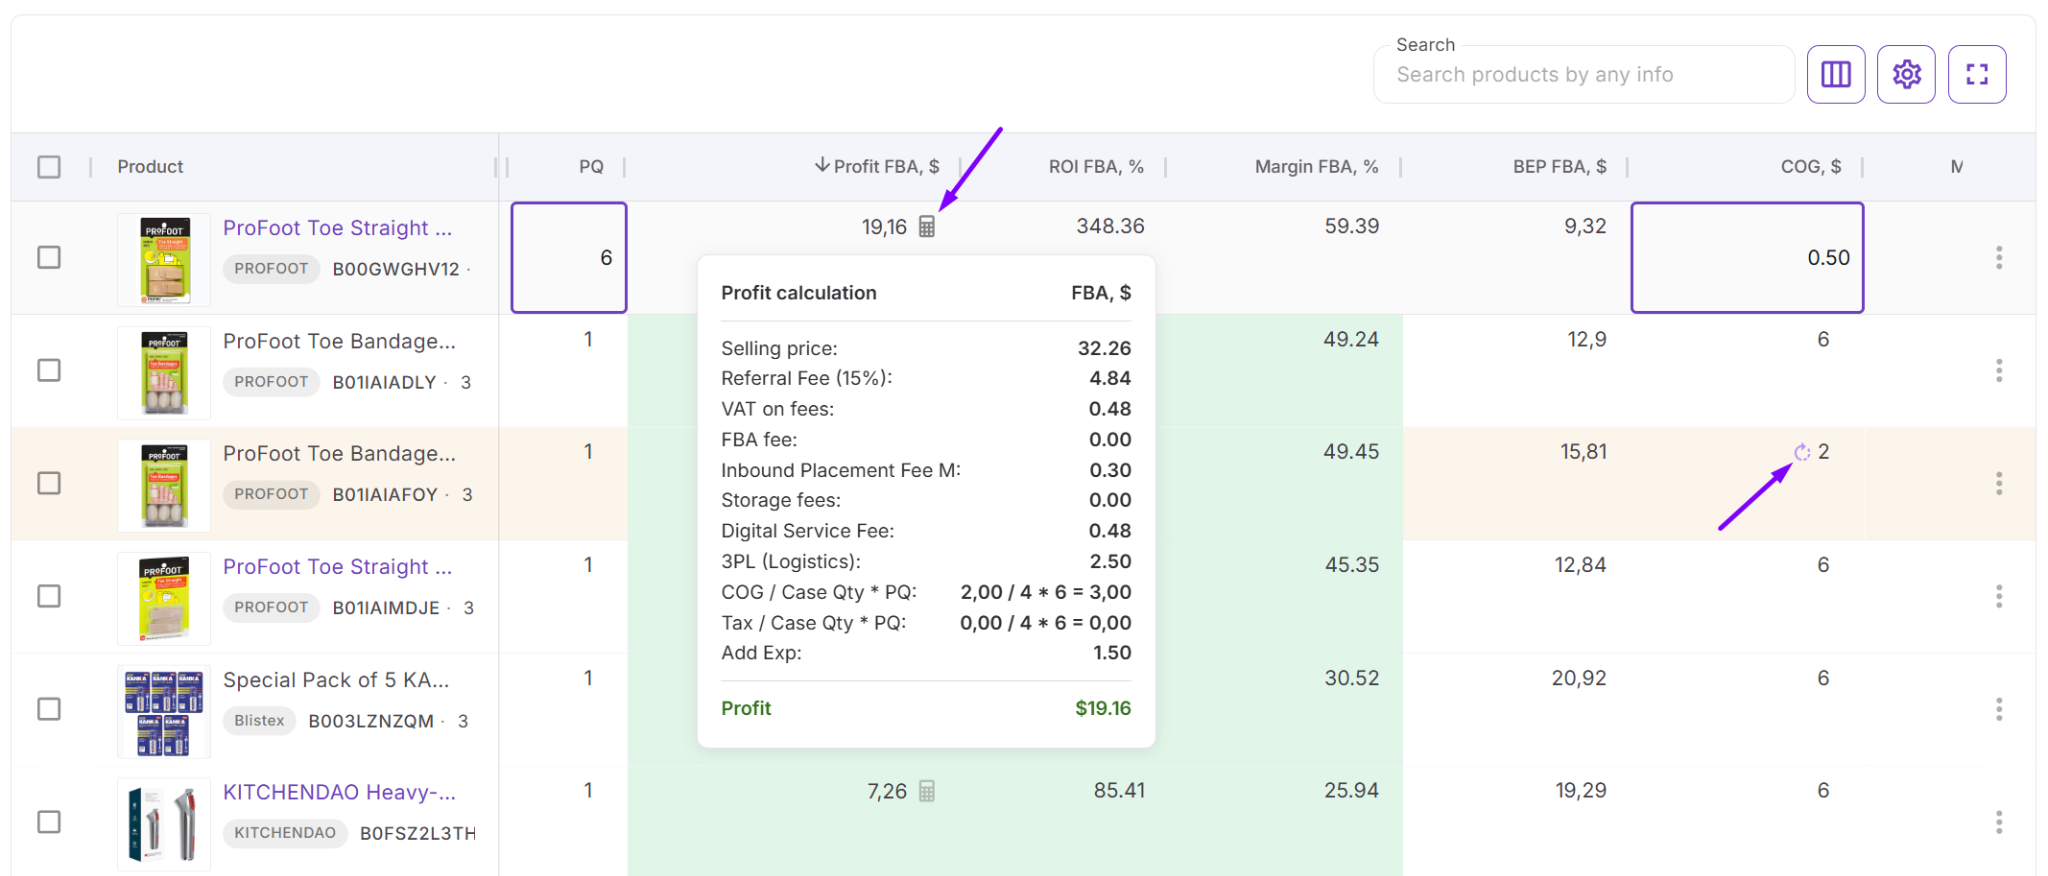
- Recalculate profitability with different costs. Adjust COG, shipping, prep fees, taxes, package quantities, and other expenses to see how they affect potential returns without uploading the file again.
- Keep sourcing decisions organized. Mark products with likes or dislikes, add tags and notes, and use saved views to track candidates and coordinate reviews with your team.
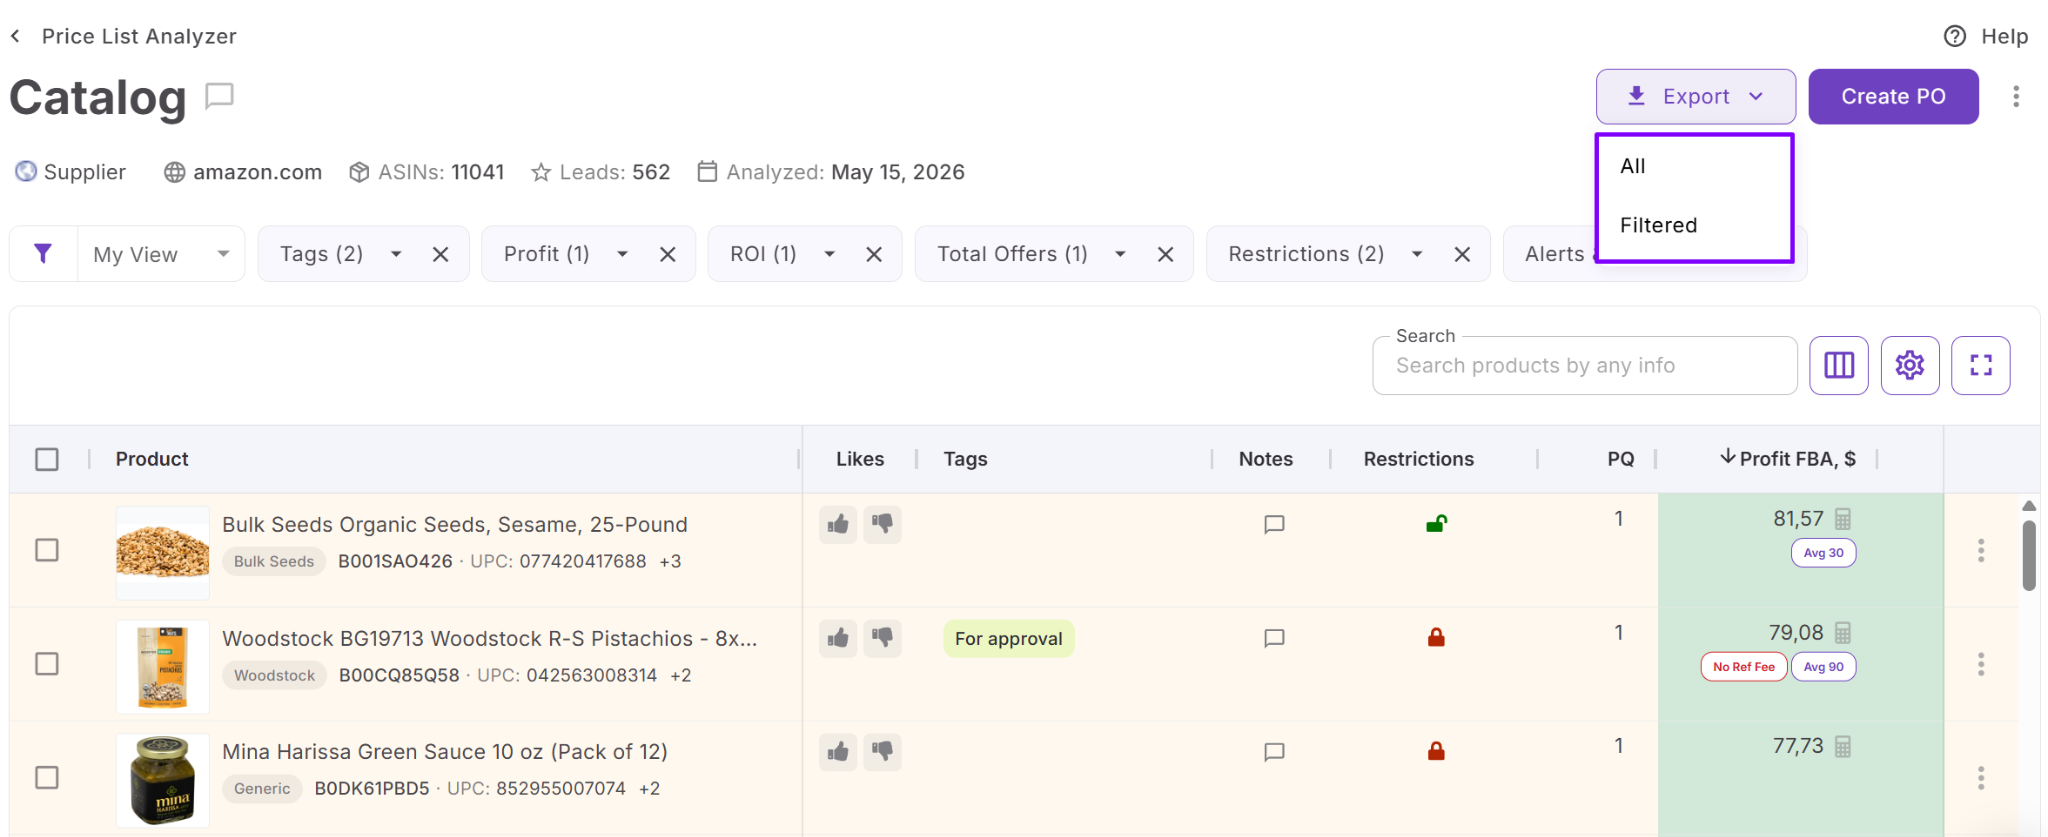
- Export relevant product data. Download the full analysis, filtered results, or selected products for further research and purchasing decisions.
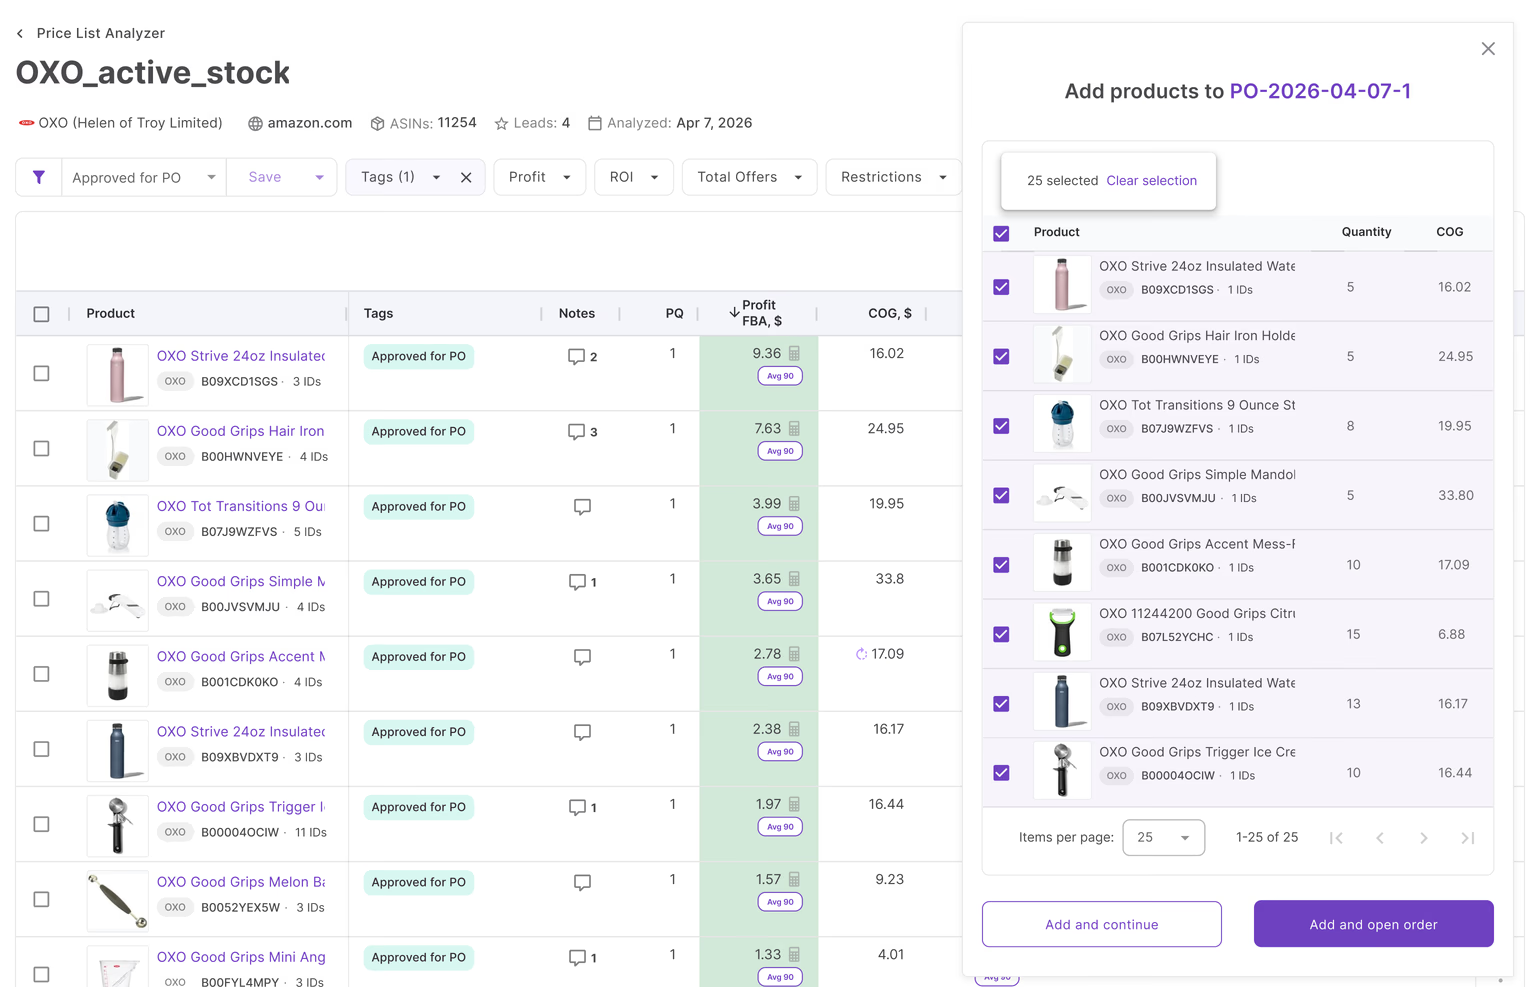
- Move selected products into purchase orders. Use Add to PO to transfer promising products into Seller Assistant’s purchase order workflow without entering their details again.
How to analyze a supplier price list in 6 steps
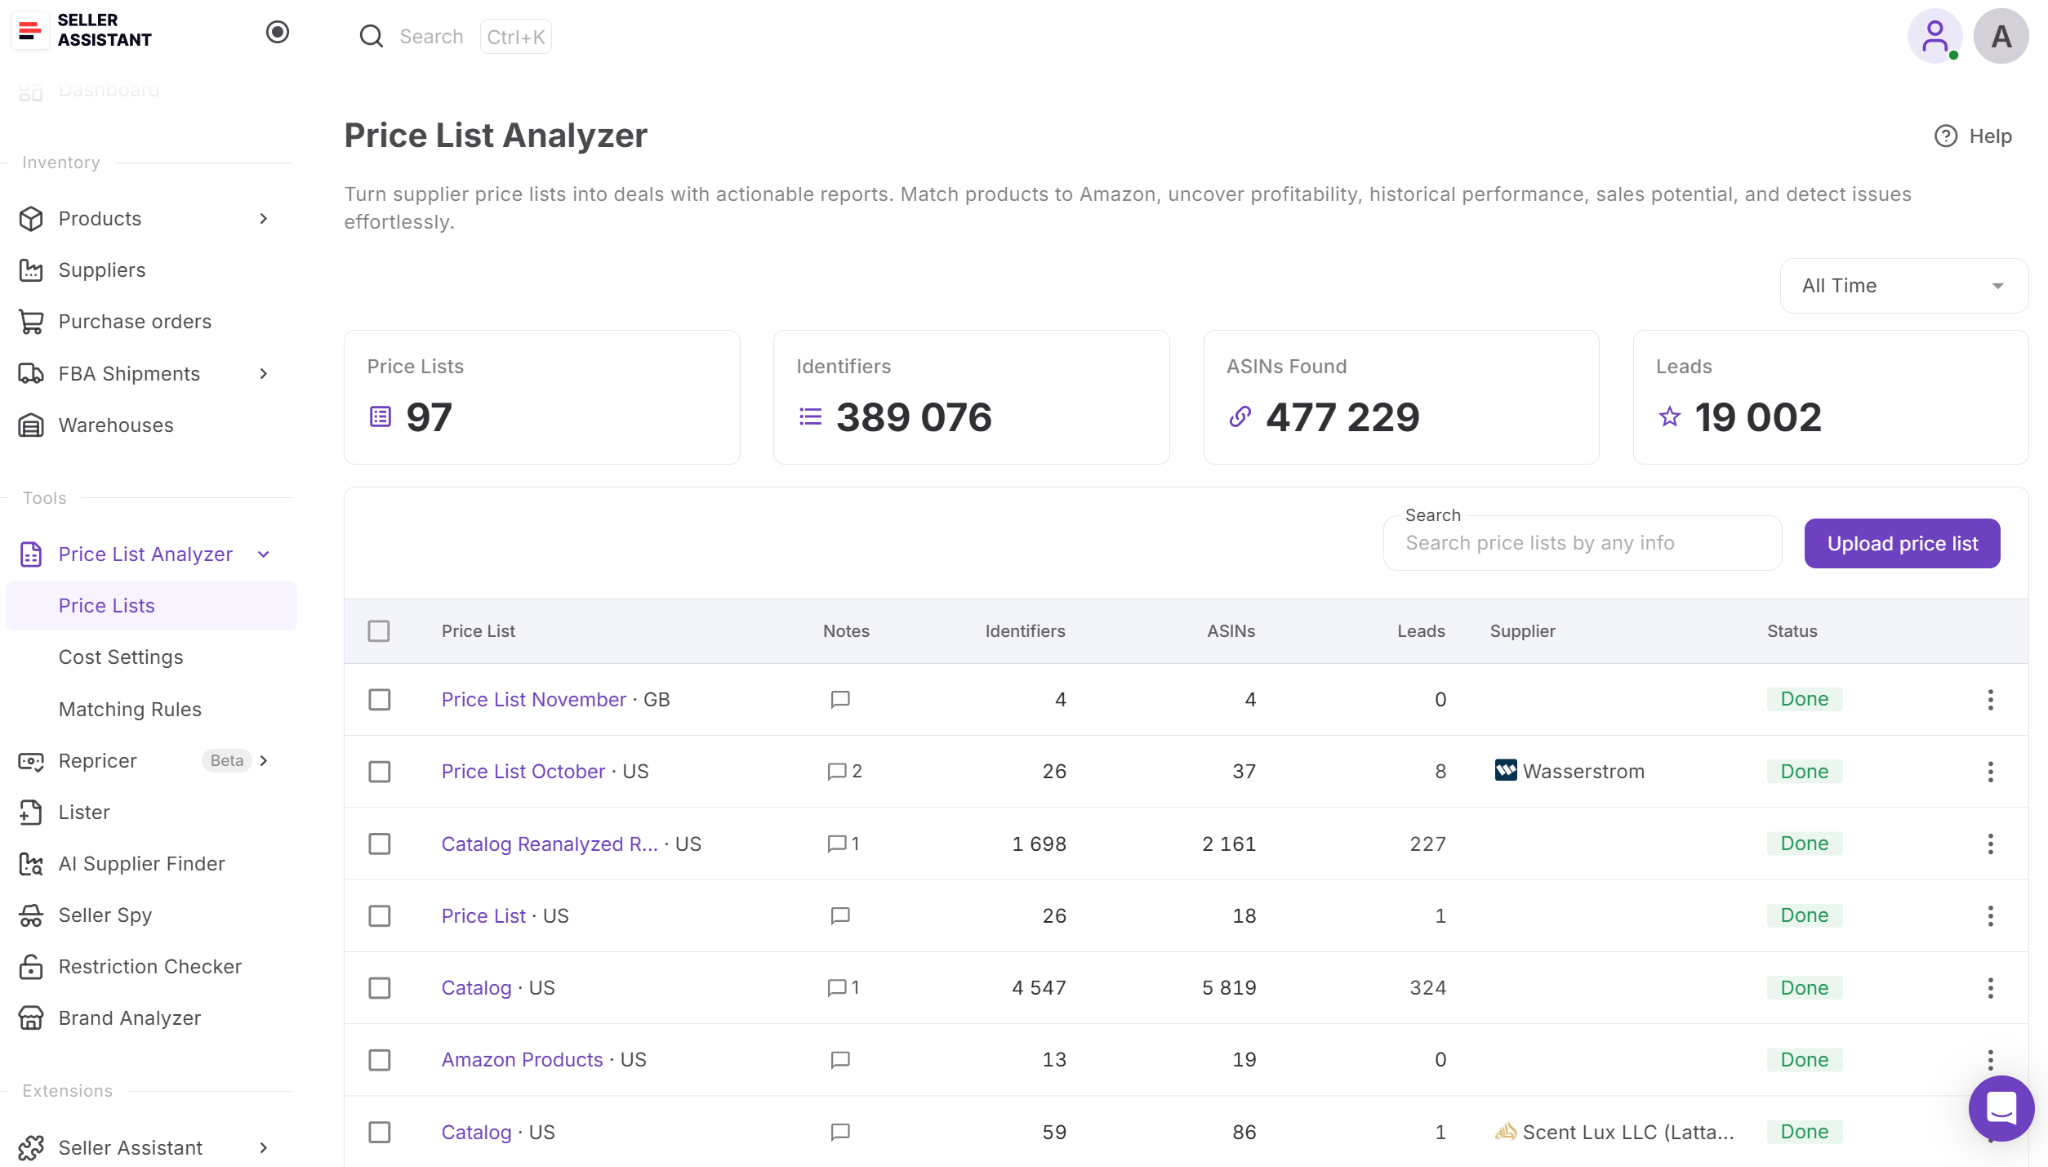
Step 1. Upload your supplier price list
Open your Seller Assistant account, go to Tools → Price List Analyzer, and click Upload price list. Select your Amazon marketplace and upload the supplier’s .xlsx or .xls file.
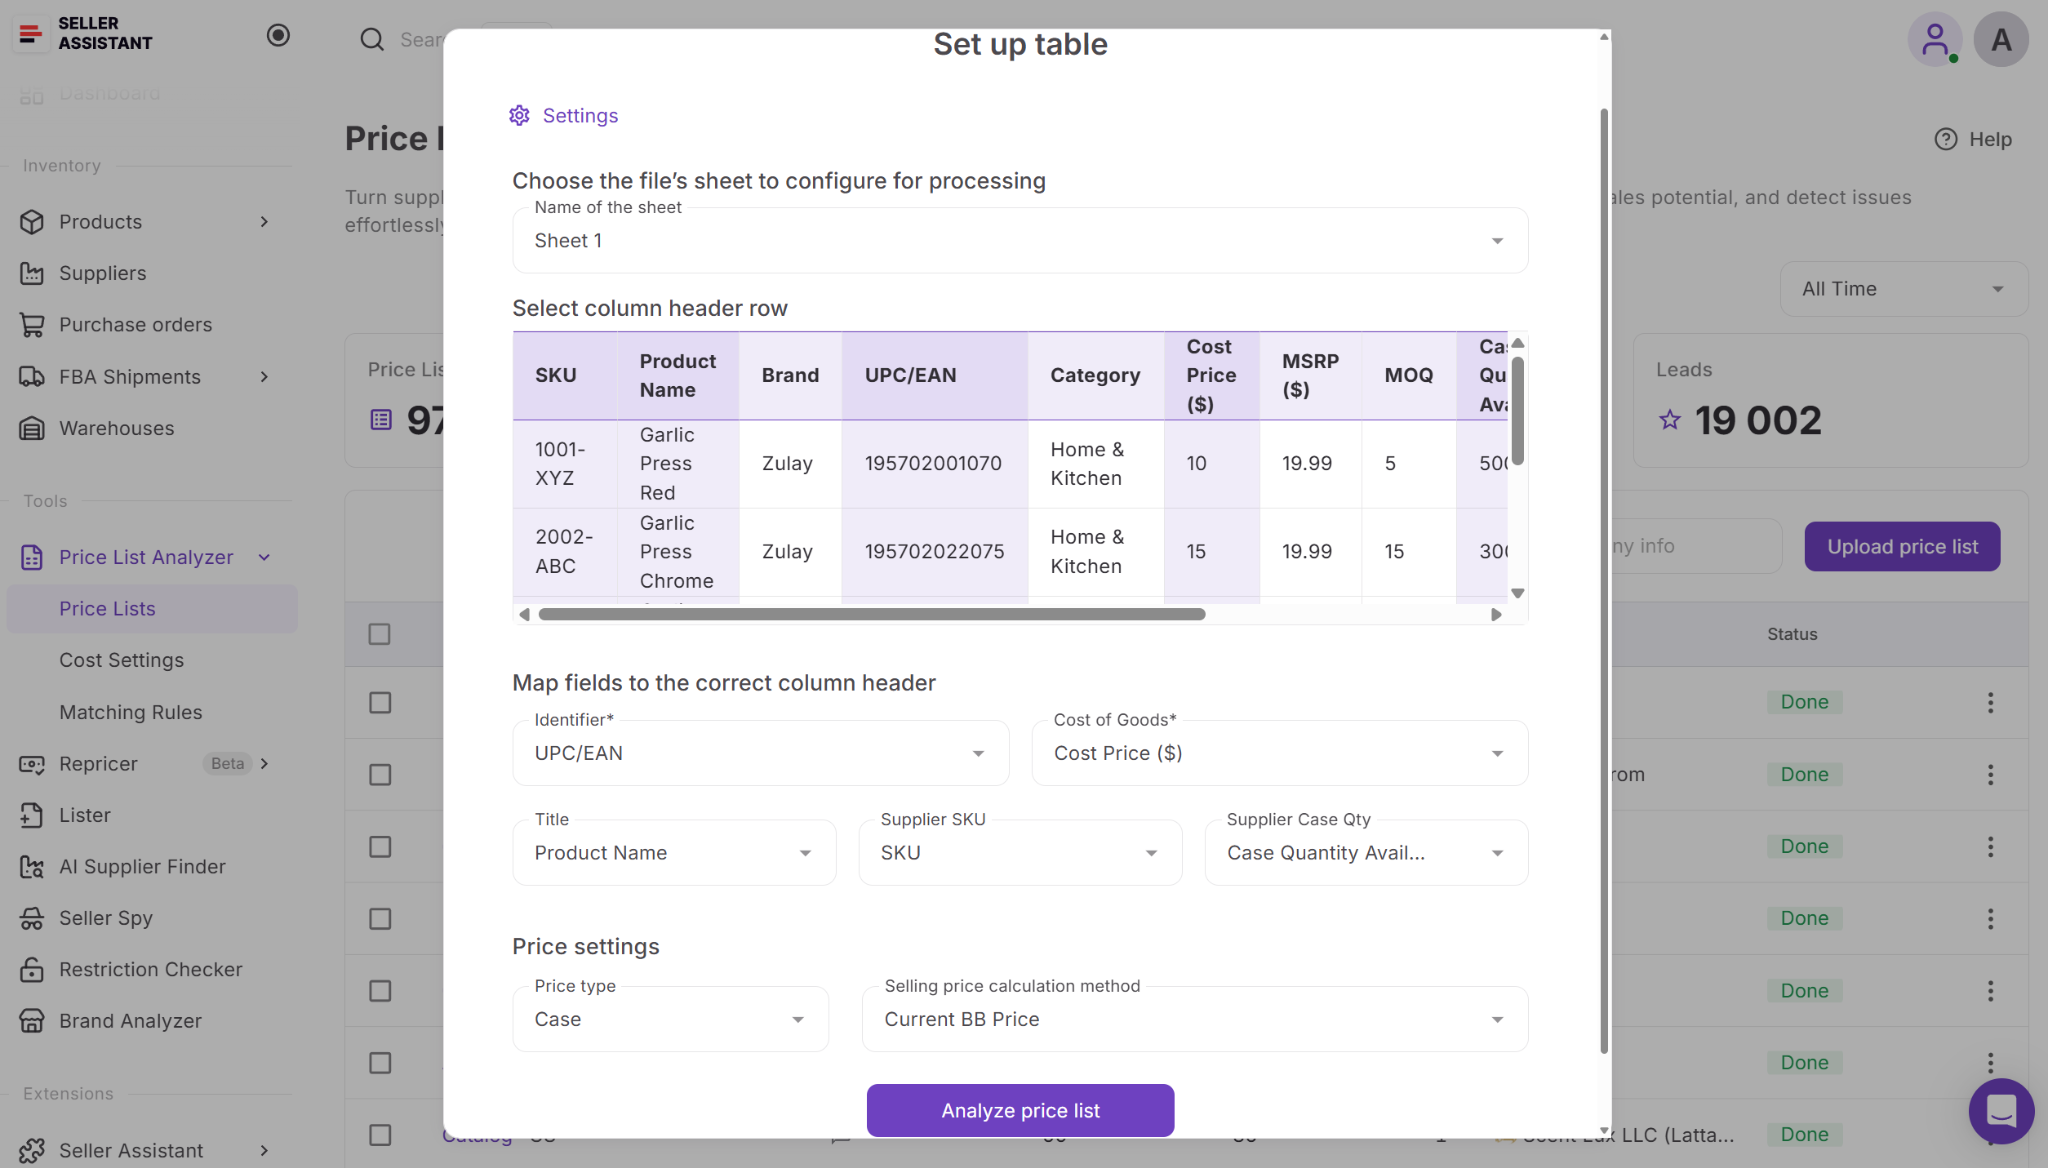
Step 2. Map product identifiers and costs
Match the columns in your supplier file to the required fields, including product identifiers and COG. Configure the relevant analysis settings, then click Analyze Price List.
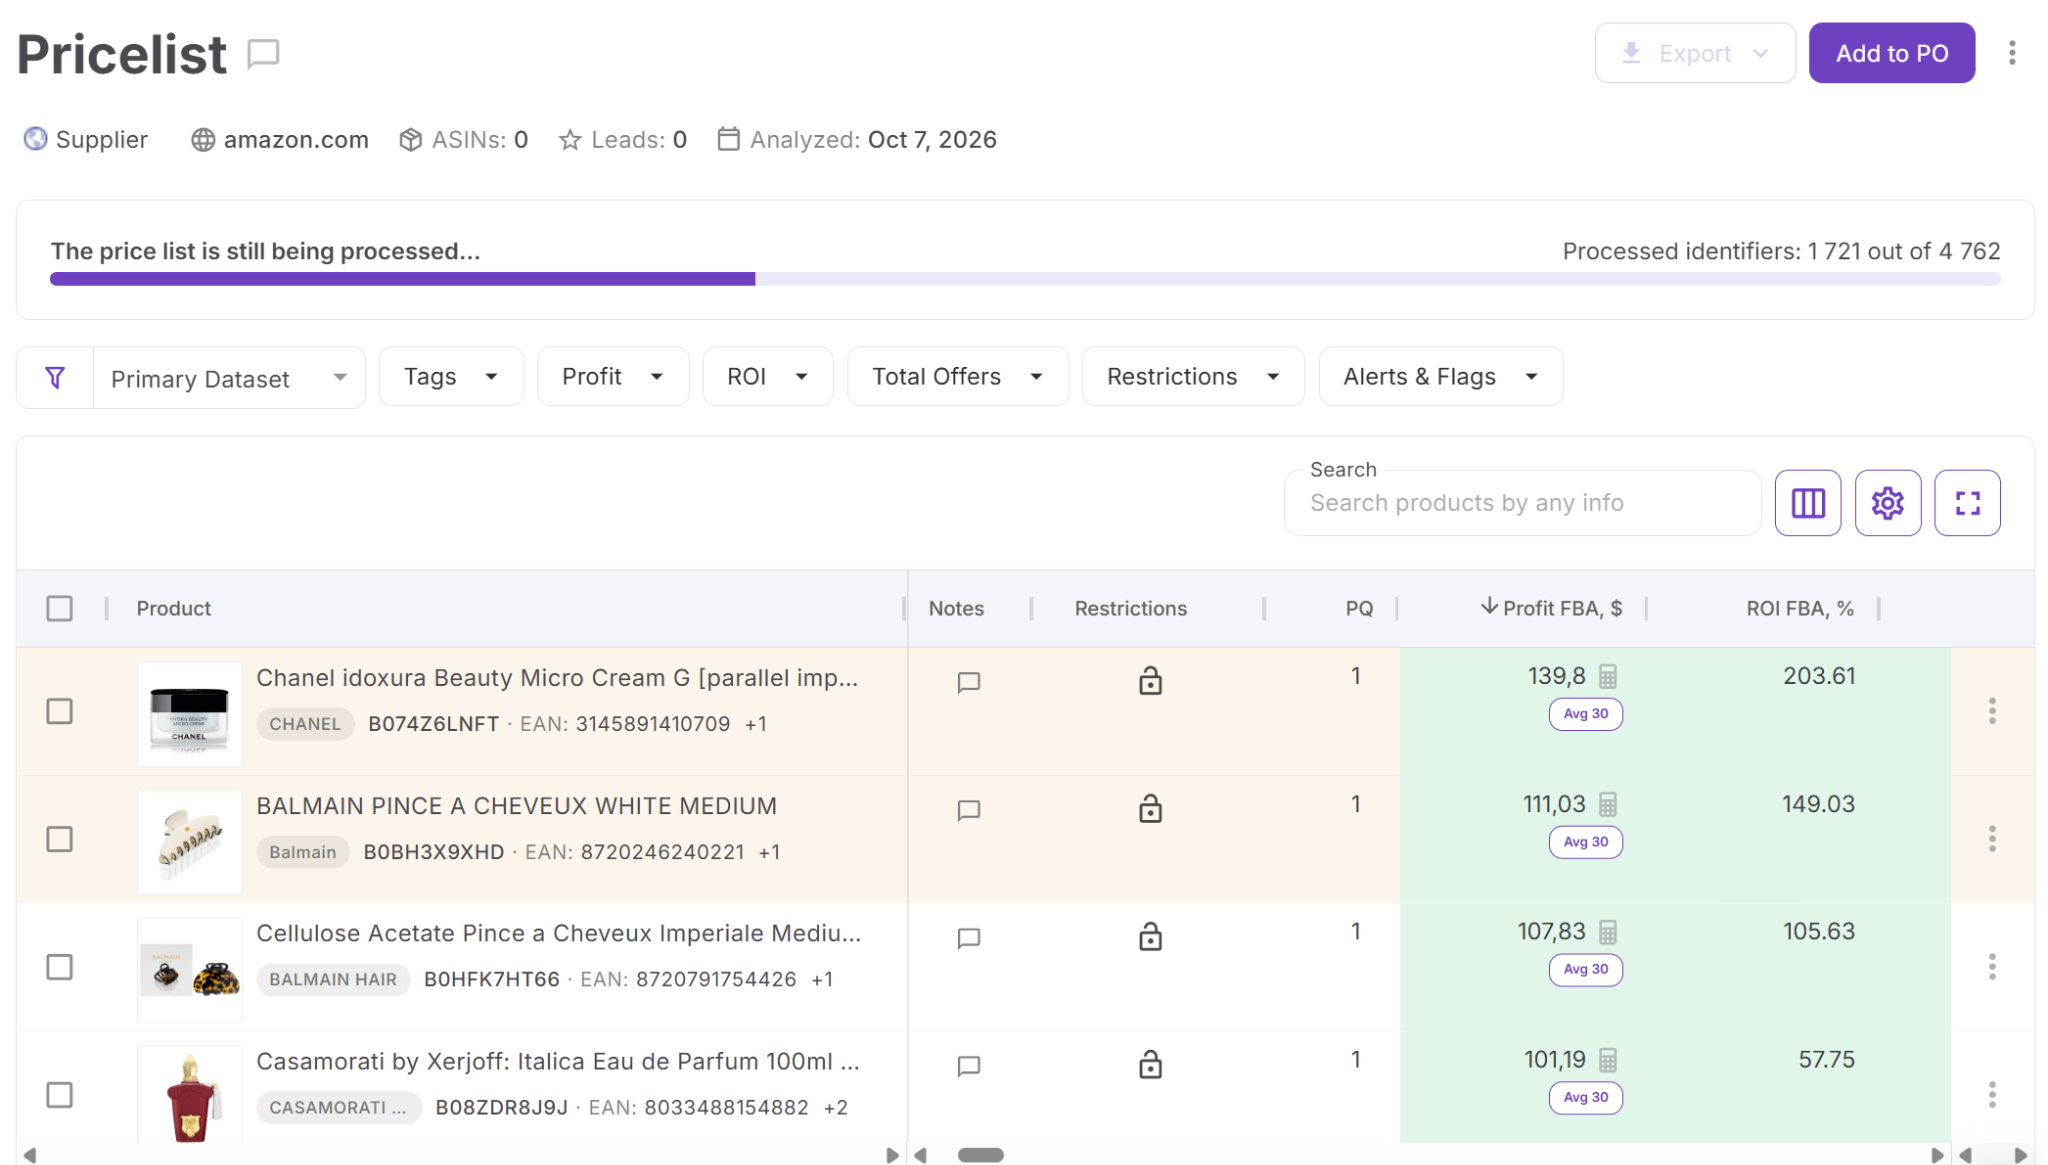
Step 3. Review Amazon matches
Once analysis begins, open the results table. You can review processed products while the remaining lines are still being analyzed. Check the matched ASINs and identify listings with missing or questionable product data.
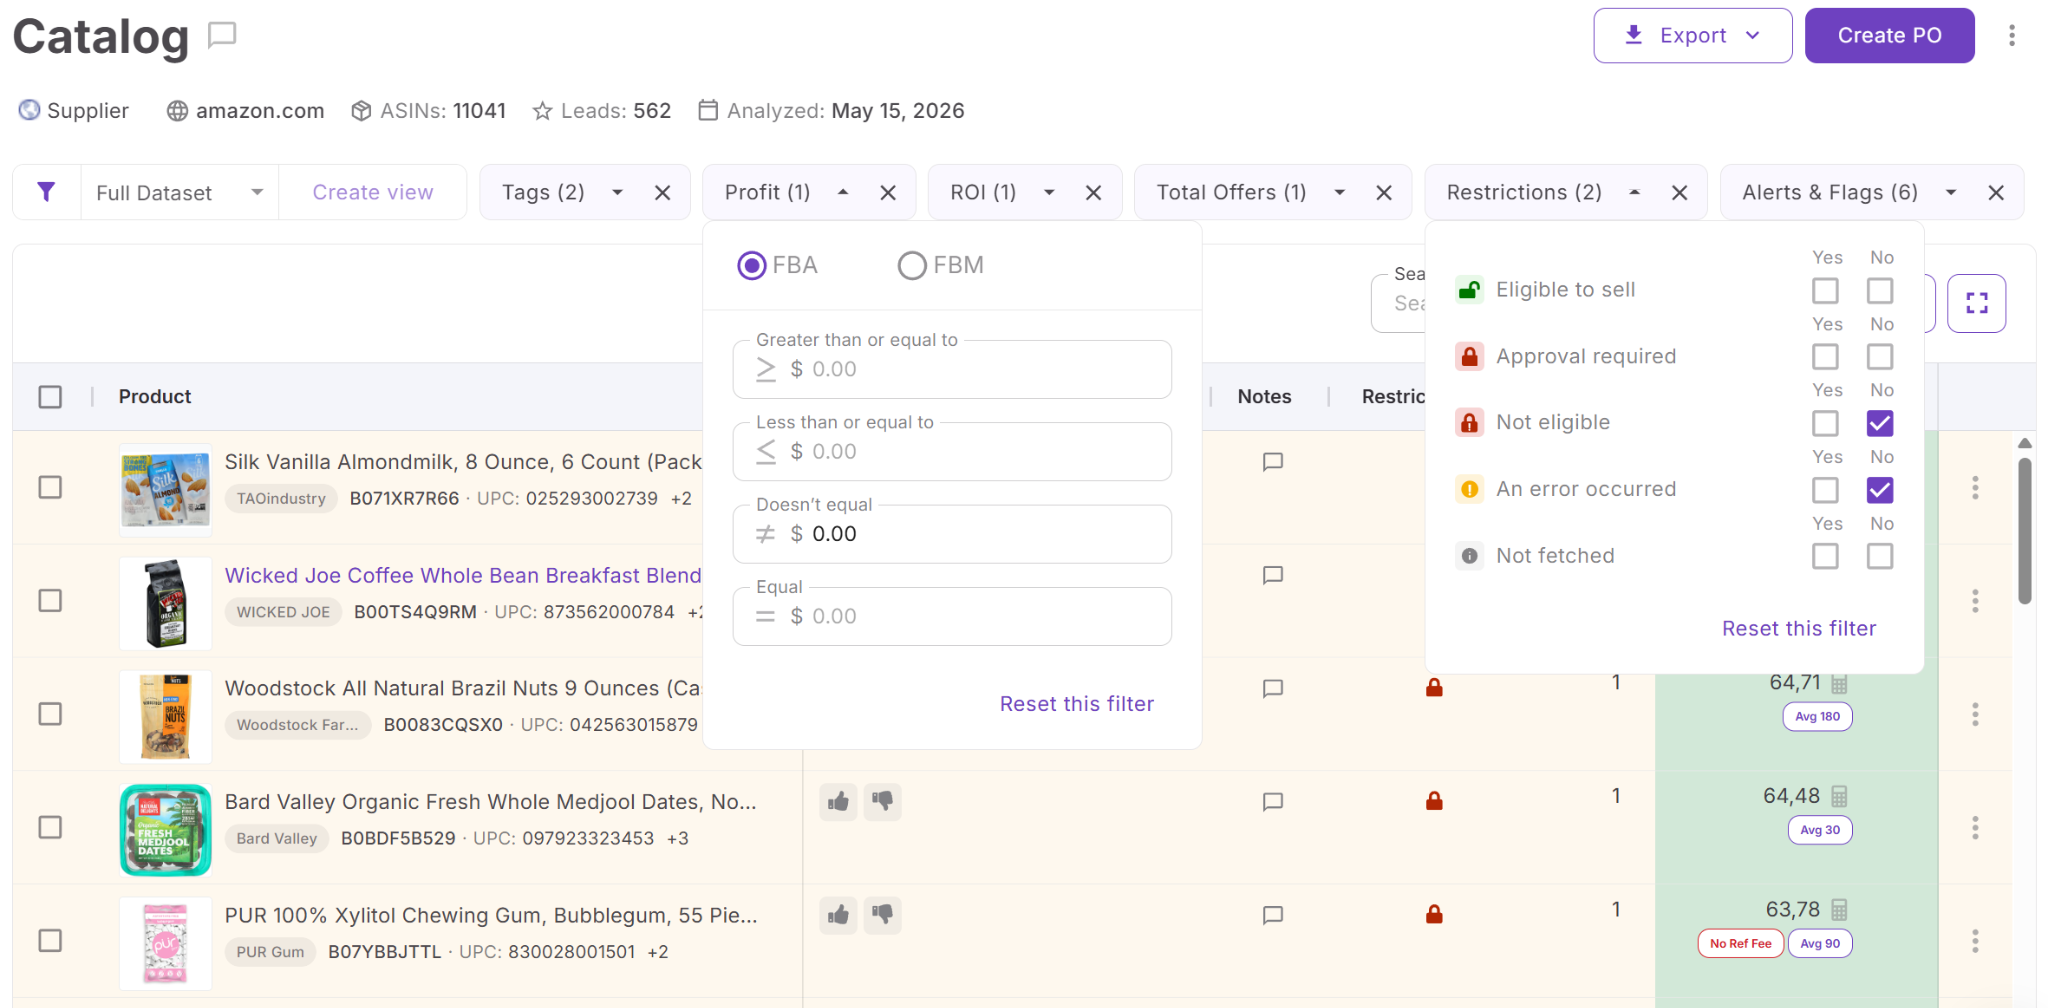
Step 4. Filter for profitability and demand
Apply your sourcing criteria, starting with the research’s 20%–200% ROI range and at least five estimated monthly sales. Review FBA or FBM profitability according to your fulfillment model, and investigate unusually high ROI values for possible product or pack-size mismatches.
Step 5. Check competition and sourcing risks
Review Amazon’s Buy Box presence, competing offers, product restrictions, and IP-related warnings. Use pricing history to assess whether the current Buy Box price is representative. Adjust COG or other expenses when necessary to test whether the opportunity remains profitable.
Step 6. Save and export your leads
Use tags, notes, and saved views to organize promising products. Export the filtered results or selected items for further verification, or use Add to PO to move candidates into Seller Assistant’s purchase order workflow.
A filtered list isn’t automatically a purchase-ready order. Confirm product quantities, supplier availability, selling eligibility, and current costs before committing to inventory.
FAQ
How many products in a supplier price list are actually profitable?
About 15% of supplier price list lines show profitability, but only 40.8 per 1,000 (4.08%) qualify as wholesale leads. Qualified leads must also meet the research’s ROI, sales, listing quality, and Buy Box requirements.
What is a good wholesale lead rate per price list?
Seller Assistant’s research found approximately 41 qualified leads per 1,000 supplier lines. Use this as a benchmark when comparing suppliers, not as a guaranteed lead rate.
Why are products with ROI above 200% excluded?
ROI above 200% can indicate an incorrect Amazon listing match or pack-size discrepancy. Such products require verification rather than being treated as confirmed wholesale leads.
Does the Amazon product category affect how many wholesale leads you find?
Yes, Beauty produces 125 qualified leads per 1,000 matched lines, compared with 43 in Home & Kitchen and 22.5 in Electronics. These category rates use matched lines rather than all supplier catalog lines.
How often should Amazon sellers analyze new supplier price lists?
Analyze new supplier catalogs as soon as they arrive, since 63% of items observed in the reporting year were new. Regular scans also help identify changes in profitability, demand, and competition.
Final Thoughts
According to Seller Assistant’s State of Amazon Wholesale (Q3 2026), only about 41 of every 1,000 supplier price list lines are real Amazon leads. About 15% of lines are profitable, but most fail on data quality, thin margins, low sales or Amazon holding the Buy Box.
For your next price list, that means:
- Judge suppliers by lead rate, not list size. About 40 leads per 1,000 lines is typical, so a list well below that needs a data check first.
- Fix the data before you judge the products. Missing UPCs, blank costs and case-versus-unit pricing remove more lines than any margin check.
- Filter on sales before ROI. Half of the lines with 20%+ ROI sell fewer than 5 units a month.
- Treat ROI above 200% as an error until verified.
- Scan new catalogs right away and check brands before you order.
Price List Analyzer runs these checks on any supplier file in minutes. Start a free trial to find the leads in your next price list, or read the full report for category data and methodology.