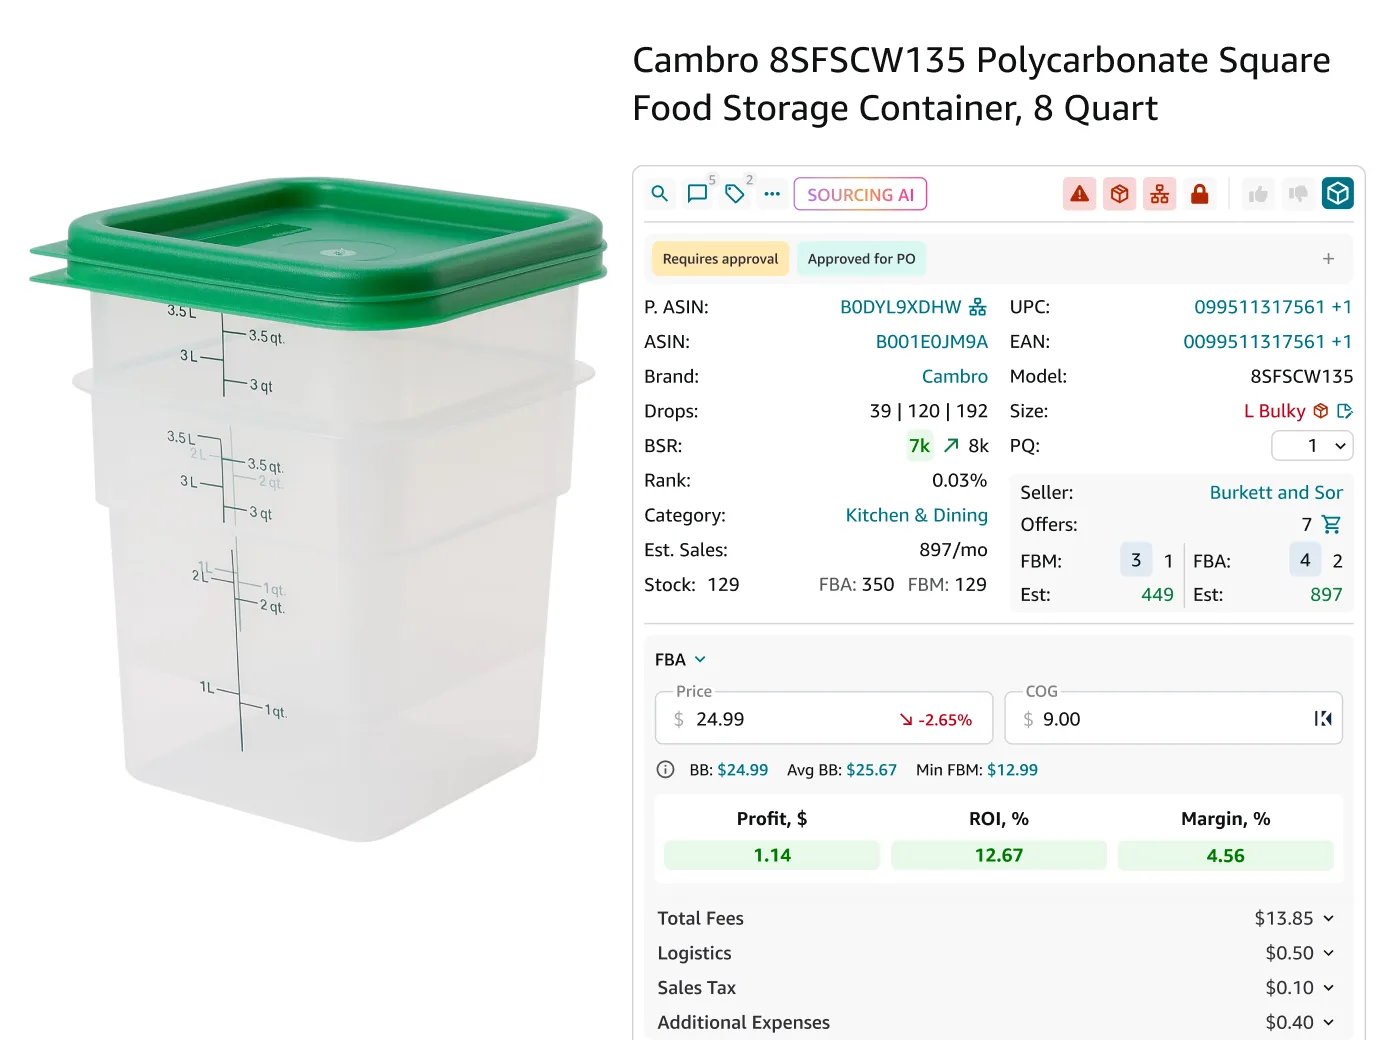


To decide what to sell on Amazon in 2026, choose your business model first, then a category where you can win the Buy Box, then single products that pass a check of sales, profit, eligibility and IP risk. The product check matters more than the category. In Seller Assistant’s State of Amazon Wholesale, Q3 2026, only about 41 of every 1,000 supplier lines were real leads, and in every category the gap between the best and the worst sellers was larger than the gap between categories.
This guide goes through the decision in that order. For lists of product ideas, see best product ideas for Amazon FBA and the best items to resell.
Choose Your Business Model First
Your business model decides what you can buy, how much money you need and where your product ideas come from. A good wholesale buy (a case of an established brand from its distributor) can be a poor online arbitrage buy, and the other way around.
| Model | What you buy | Money to start | Main risk | Where ideas come from |
|---|---|---|---|---|
| Wholesale | Cases of established brands from distributors or the brand | Supplier minimum orders | Brand gating, a locked Buy Box | Brand lists, supplier price lists |
| Online arbitrage | Discounted units from retail sites | Low: you buy unit by unit | IP complaints, price drops | Retail sales, Amazon demand lists |
| Private label | Your own brand, made for you | Highest: product, photos, ads | Launch cost, copycat listings | Customer problems, review gaps |
Fulfillment is a separate choice. With FBA, Amazon stores and ships your units for a fee per unit. With FBM, you ship yourself. Both use the same selling plans. As of October 2026, the Individual plan costs $0.99 per item sold and the Professional plan costs $39.99 a month, plus referral fees of 3% to 45% of the price, depending on the category.
Most of the data in this guide comes from wholesale sellers, because they upload whole supplier catalogs. The Buy Box, Amazon presence and demand numbers apply to online arbitrage too, because they describe Amazon listings, whoever sources the units. If wholesale is your model, this video shows the full path in about 4 minutes, from a brand check to repricing the listing.
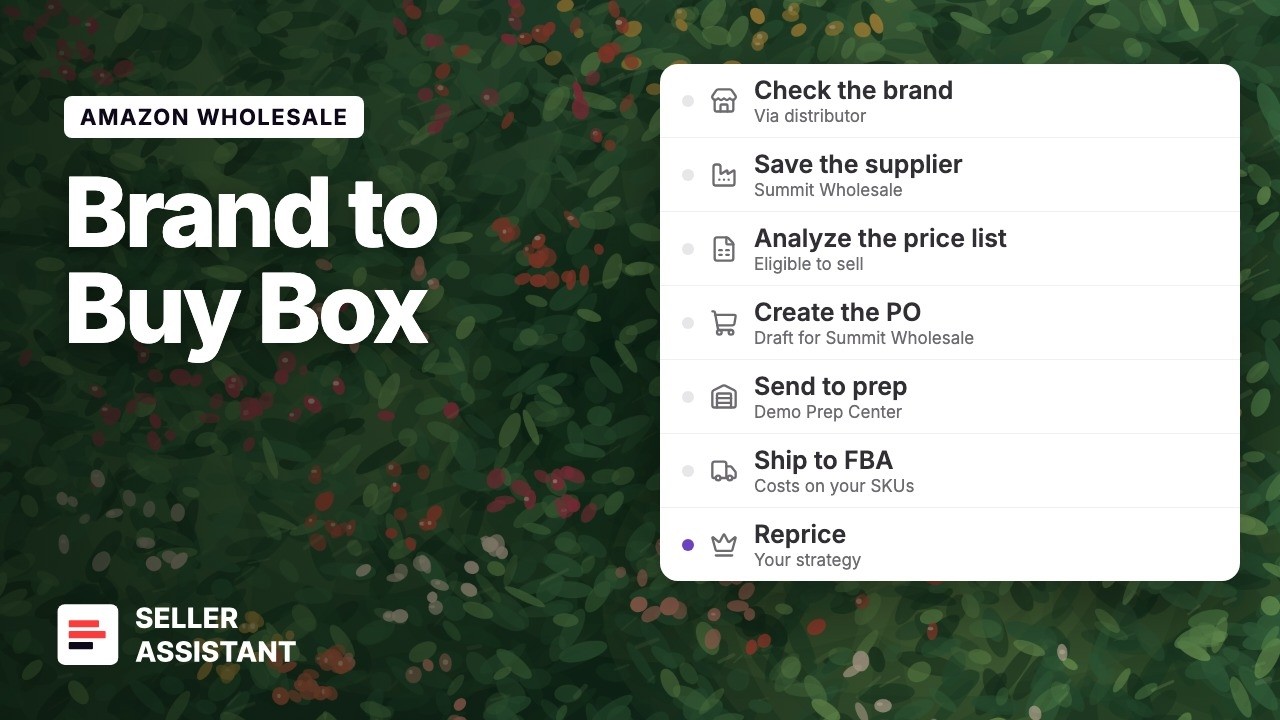
Check your first brand and price list in Seller Assistant.
Pick a Category by Its Lead Data
Amazon’s Best Sellers list shows what sells. It does not show what you can sell. On many of the top products, the brand or Amazon itself holds the Buy Box, and a new reseller gets few sales. For a reseller, a good category has many products that pass the lead checks, few listings that one seller locks, and demand that holds.
The table shows these numbers for the larger categories on Amazon.com. A lead is a supplier line with a checkable Amazon listing that gives 20% to 200% ROI after Amazon’s fees, sells at least 5 units a month (estimated) and does not have Amazon on the Buy Box. A listing is locked when one seller wins the Buy Box 80% of the time or more.
| Category | Leads per 1,000 matched lines | Locked listings | Amazon on the Buy Box (change in pts) | Est. sales vs a year ago |
|---|---|---|---|---|
| Beauty & Personal Care | 125 | 41% | 22.4% (−0.9) | 0.0% |
| Kitchen & Dining | 118 | 54% | 35.5% (−1.0) | −6.0% |
| Clothing, Shoes & Jewelry | 110 | 57% | 25.2% (−1.4) | −6.9% |
| Arts, Crafts & Sewing | 85 | 43% | 17.0% (−1.5) | −0.9% |
| Sports & Outdoors | 83 | 51% | 21.6% (−0.5) | −6.6% |
| Pet Supplies | 76 | 62% | 32.0% (−0.5) | −5.9% |
| Grocery & Gourmet Food | 72 | 38% | 20.6% (−0.5) | +9.9% |
| Toys & Games | 71 | 48% | 32.7% (−6.3) | −12.3% |
| Health & Household | 55 | 54% | 20.0% (−0.9) | −0.8% |
| Automotive | 45 | 51% | 20.7% (−1.3) | −22.8% |
| Home & Kitchen | 43 | 49% | 22.8% (−1.7) | −5.2% |
| Video Games | 40 | 35% | 19.2% (−6.7) | −14.7% |
| Baby | 36 | 57% | 41.5% (+0.2) | −19.3% |
| Tools & Home Improvement | 31 | 54% | 20.0% (−1.1) | 0.0% |
| Electronics | 23 | 50% | 27.8% (−1.6) | −0.7% |
| Books | not measurable | 64% | 51.4% (−4.0) | not measurable |
Source: Seller Assistant, State of Amazon Wholesale, Q3 2026. 13.5 million supplier lines from 782 wholesale sellers, Amazon.com, July 2025 to August 2026. Leads use the 100 sellers who scan regularly. “Amazon on the Buy Box” is the share of repeat products where Amazon held the Buy Box on more than half of the scans in 2026. All categories together: 55 leads per 1,000 matched lines, 49% of listings locked.
Where resellers find the most leads
Beauty & Personal Care, Kitchen & Dining and Clothing, Shoes & Jewelry give about twice the average number of leads. Each one has a catch. In Beauty, the median seller finds 93 leads per 1,000 lines, because sellers with large catalogs pull the average up. Amazon holds the Buy Box on 35.5% of Kitchen & Dining products. Clothing changes almost completely from year to year: 93% of the clothing items scanned in 2026 were new, so last year’s supplier catalog tells you little.
Which categories opened up in 2026
Grocery & Gourmet Food is the most open category (38% of listings locked), the only one where estimated sales increased (+9.9%) and the only one where the number of sellers increased. Expect multipacks. One Grocery supplier line matches 1.6 Amazon listings on average, so compare the unit count on each listing with the supplier’s unit.
Amazon left many Toys & Games listings (−6.3 points) and Video Games listings (−6.7 points). A toy or a game that you rejected last year because Amazon held the Buy Box can be open now. Demand in both categories decreased, so buy smaller quantities.
Which categories got harder
Books is the most difficult category for resellers. Only 21% of the analyzed items break even, 64% of listings are locked, and Amazon holds the Buy Box on half of the repeat products. Baby has high sales per listing (149 units a month, estimated), but Amazon is on 41.5% of the products and did not leave, and estimated sales decreased by 19.3%. Automotive lost the most demand (−22.8%), and Electronics gives the fewest leads (23 per 1,000).
What fees did in 2026
Amazon raised US FBA fees by an average of $0.08 per unit on January 15, 2026, and added a fuel surcharge on April 17. On the same products before and after these changes, Amazon’s cut of the sale price stayed at about 40% for the median product and changed by 0.3 points or less in 18 of 20 categories. Books (+1.2 points) and Video Games (+0.8 points) became more expensive. The cut differs by category, from 26.7% in Video Games to 46.6% in Arts, Crafts & Sewing, so calculate Amazon fees for each product.
Find Product Ideas for Your Model
Each model has its own best source of ideas. Use the one that matches how you buy.
Wholesale: start from brands, then price lists
A wholesale seller sells brands, so the first decision is the brand. A brand is worth reselling when several sellers share its Buy Box, Amazon is rarely on its listings and its products sell through distributors that open accounts. Brand Analyzer checks up to 1,000 brands at a time and gives each one a resale potential score (Low, Medium or High), the Amazon Buy Box rate, the average seller count and the distribution type.
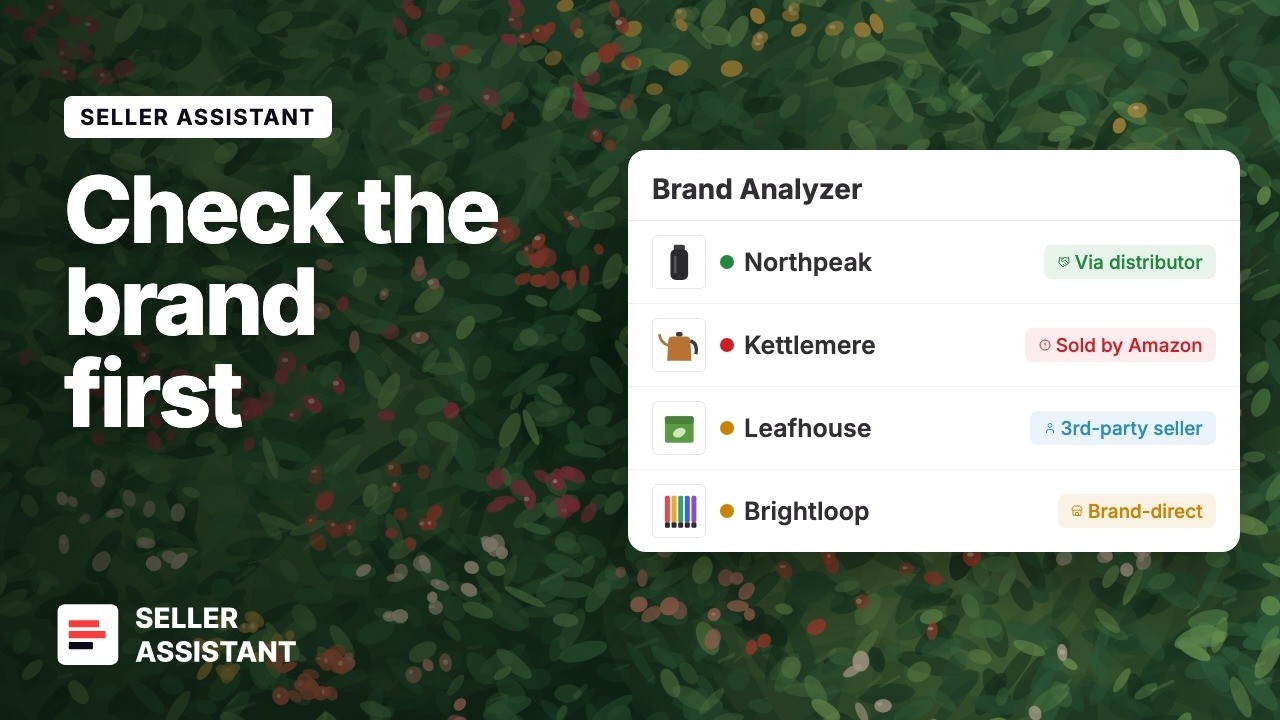
Check the next brand on your list before you order.
When you have a supplier for the brand, upload its price list to Price List Analyzer. It matches every UPC to its Amazon listing and shows profit, ROI, sales and restrictions on your own account for each product, so you see the leads in the catalog in minutes.
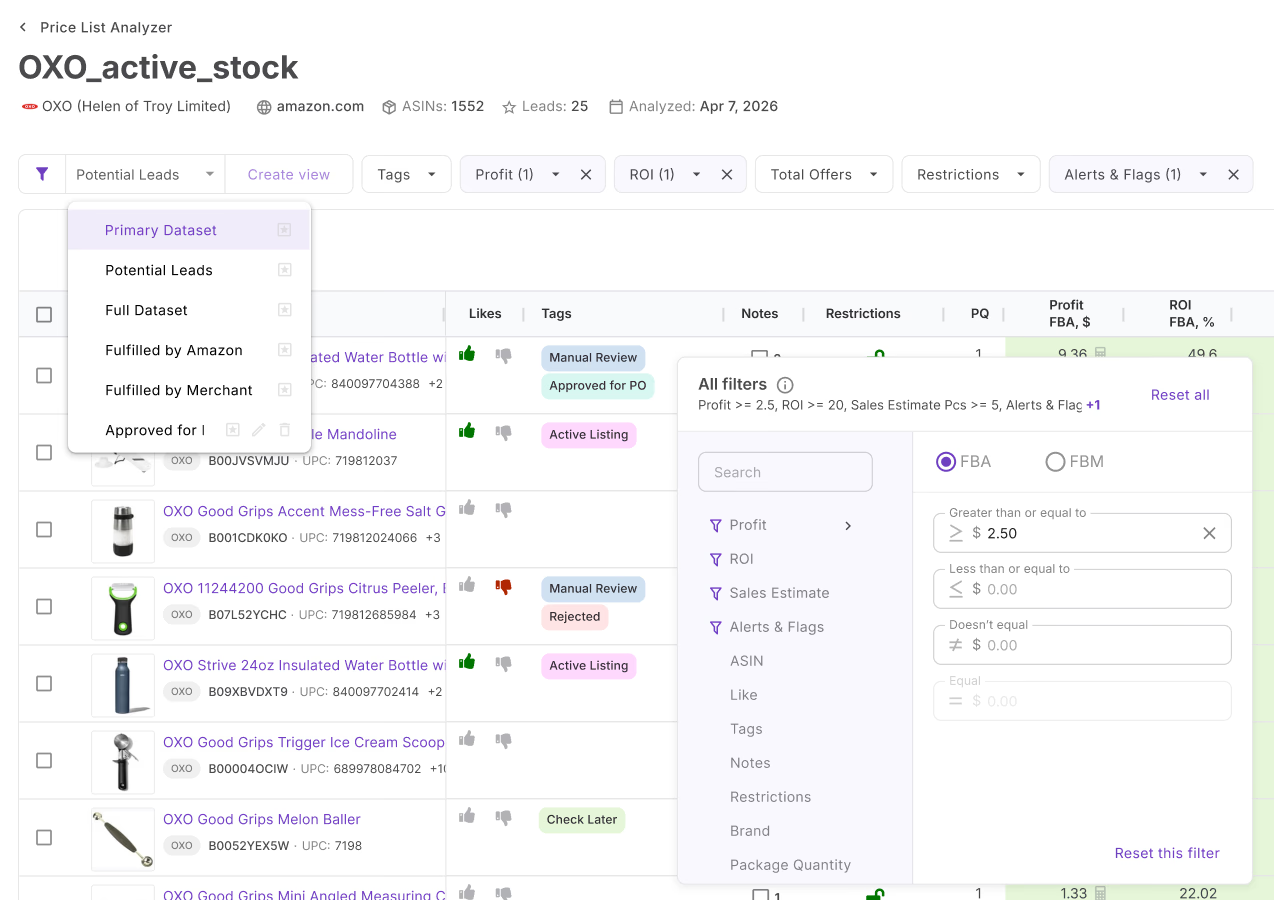
Price List Analyzer: filter a supplier catalog down to the products you can sell at a profit
Online arbitrage: start from retail discounts and Amazon demand
An online arbitrage seller buys single units on sale, so the ideas come from retail clearance pages and from products that already sell on Amazon. Amazon’s own lists show where demand is now:
- Best Sellers: the products that sell most in each category.
- Movers & Shakers: the biggest gains in sales rank over the last 24 hours.
- Hot New Releases: the best-selling new products.
- Most Wished For: the products that shoppers add to wish lists most often.
Use these lists to find brands and product types, then look for the same items at a lower price on retail sites. The Side Panel View in the Seller Assistant extension shows the Amazon profit, ROI and restrictions for a product while you are on the retailer’s page.
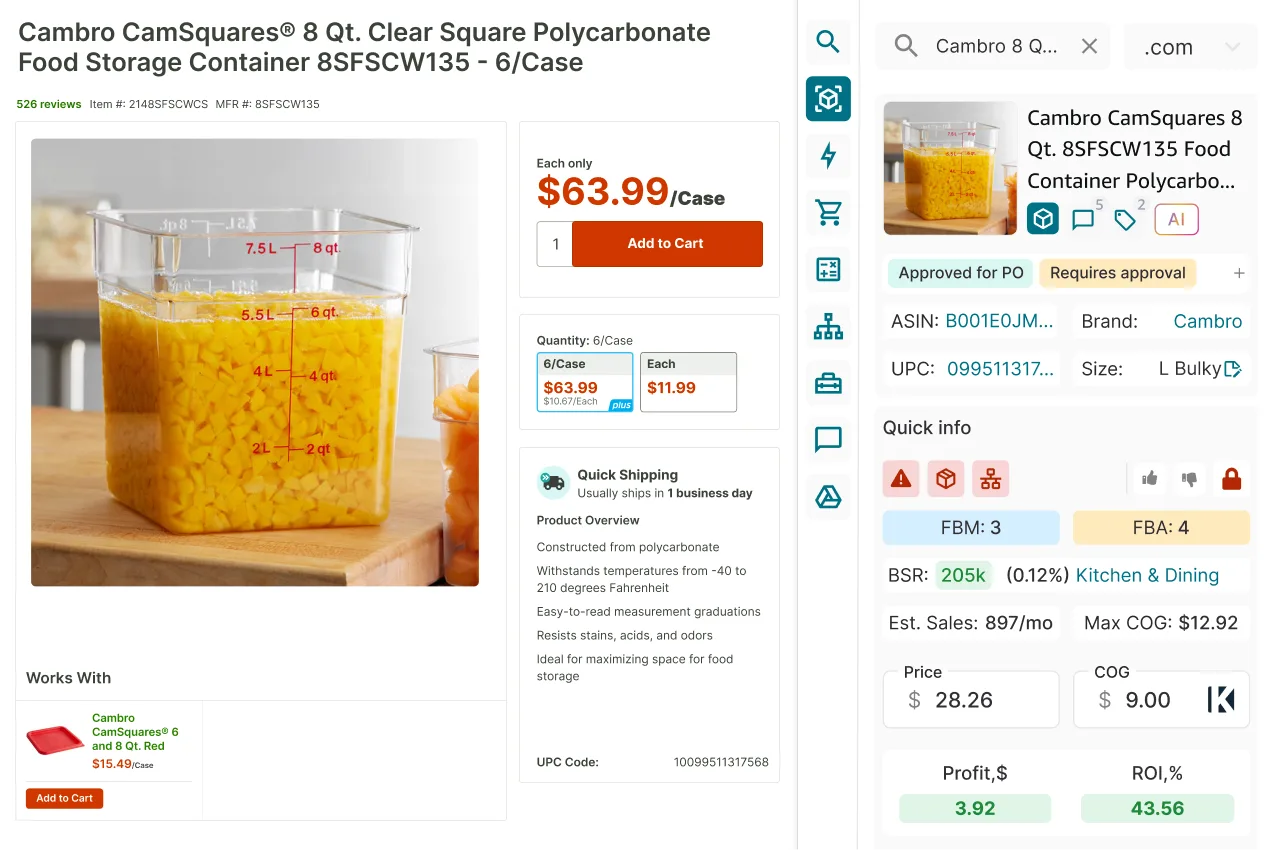
Side Panel View: check the Amazon numbers without leaving the retail site
Any model: watch what your competitors add
Sellers who sell well in your niche have already tested what works. Seller Spy tracks competitor storefronts every day and logs each product they add or remove. Its Opportunities feed lists the brands that your tracked competitors carry and you do not, ranked by how many of them stock each brand. For a manual method, see this guide to Amazon competitor analysis.
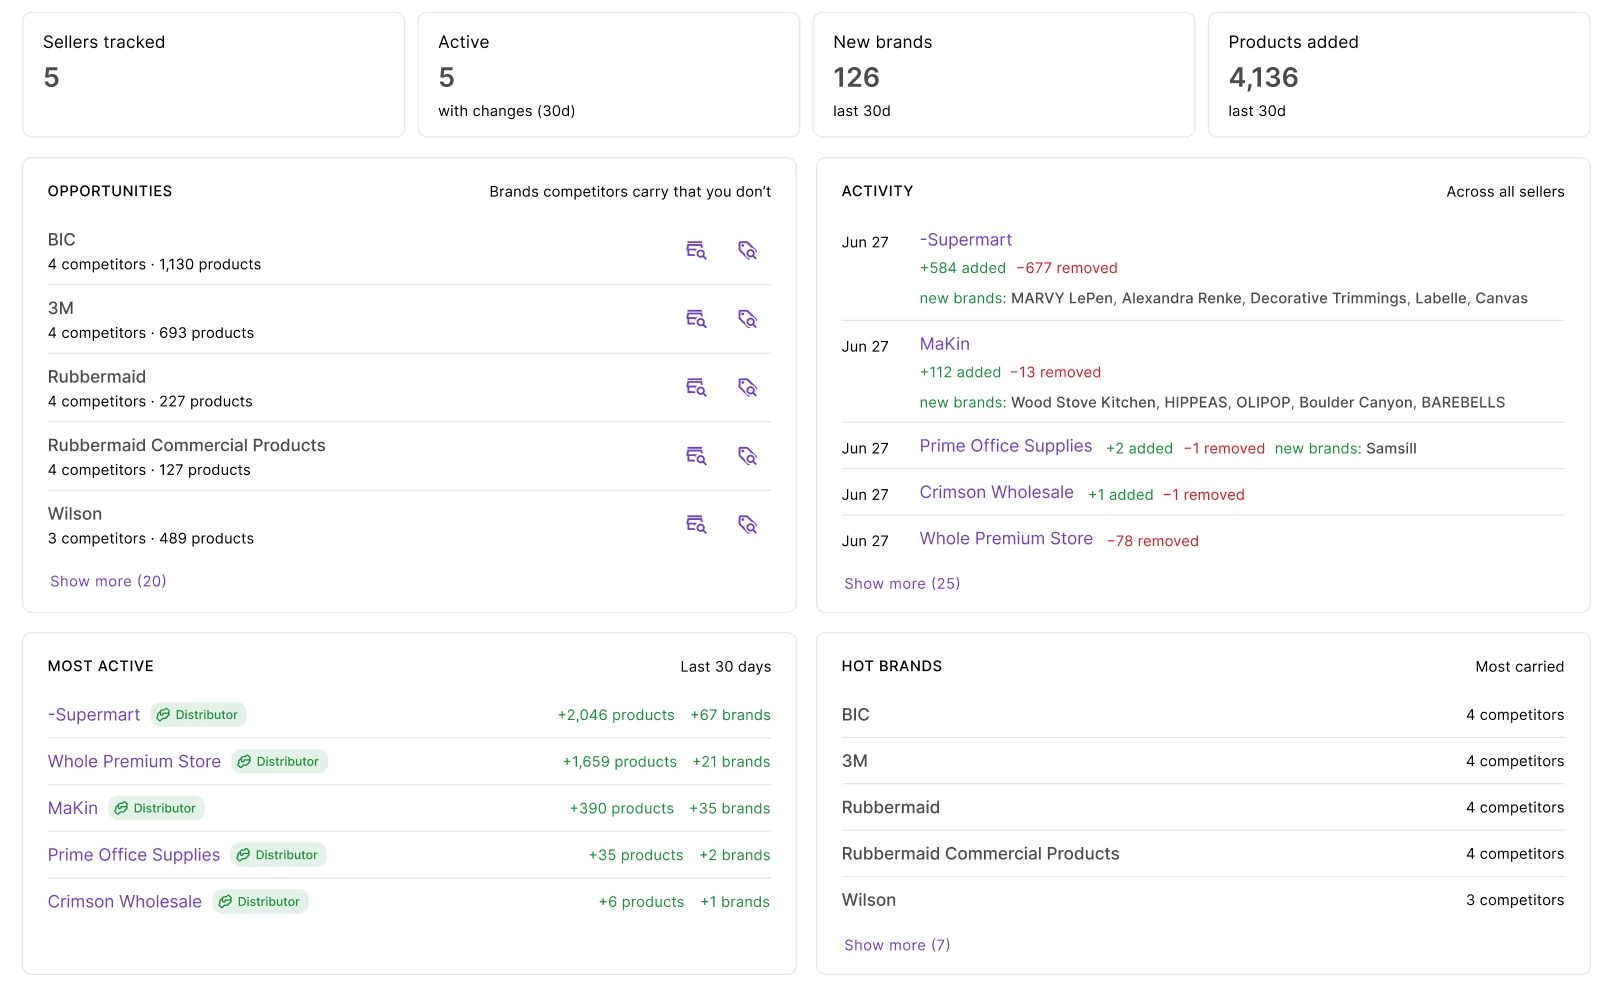
Seller Spy: brands that your competitors carry and you do not
Trends: use them, but check them
Google Trends and Amazon’s products to sell posts show rising product types. A trend product sells fast and then fills with sellers, so check it with the same numbers as any other product.
How fast a category changes also tells you how often to look for new products. 63% of the items that wholesale sellers scanned in 2026 were new, from 93% in Clothing and 88% in Electronics to 37% in Office Products and 32% in Arts, Crafts & Sewing. In the slow categories, the same supplier catalogs keep giving leads. In the fast ones, you need new catalogs every season.
Check Each Product Before You Buy
An idea becomes a product to sell only after it passes these checks. The Seller Assistant extension shows them on the Amazon product page and in search results, next to the profit calculated from your own costs.
| Check | Pass rule | Where to see it |
|---|---|---|
| Sales | The listing sells 5+ units a month, and the 90-day BSR is steady or improving | Sales estimate, BSR and BSR drops |
| Buy Box | No seller wins the Buy Box 80% of the time or more | Buy Box share by seller in Offers |
| Amazon | Amazon is not on the Buy Box | Amazon icon on product and search pages |
| Price | Today’s Buy Box price gives your target profit | Price and BSR history chart |
| Profit | 20% ROI or more after referral, FBA, prep and shipping costs | Profit calculator with your costs |
| Eligibility | Your own account can sell the product | Restriction status (lock icon) |
| IP risk | The brand or ASIN has no IP complaint history | IP-Alert (red triangle) |
| Product flags | No hazmat, meltable, fragile, oversize or adult flag that you cannot handle | Alerts and flags |
| Variation | You buy the variation that sells | Variation Viewer |
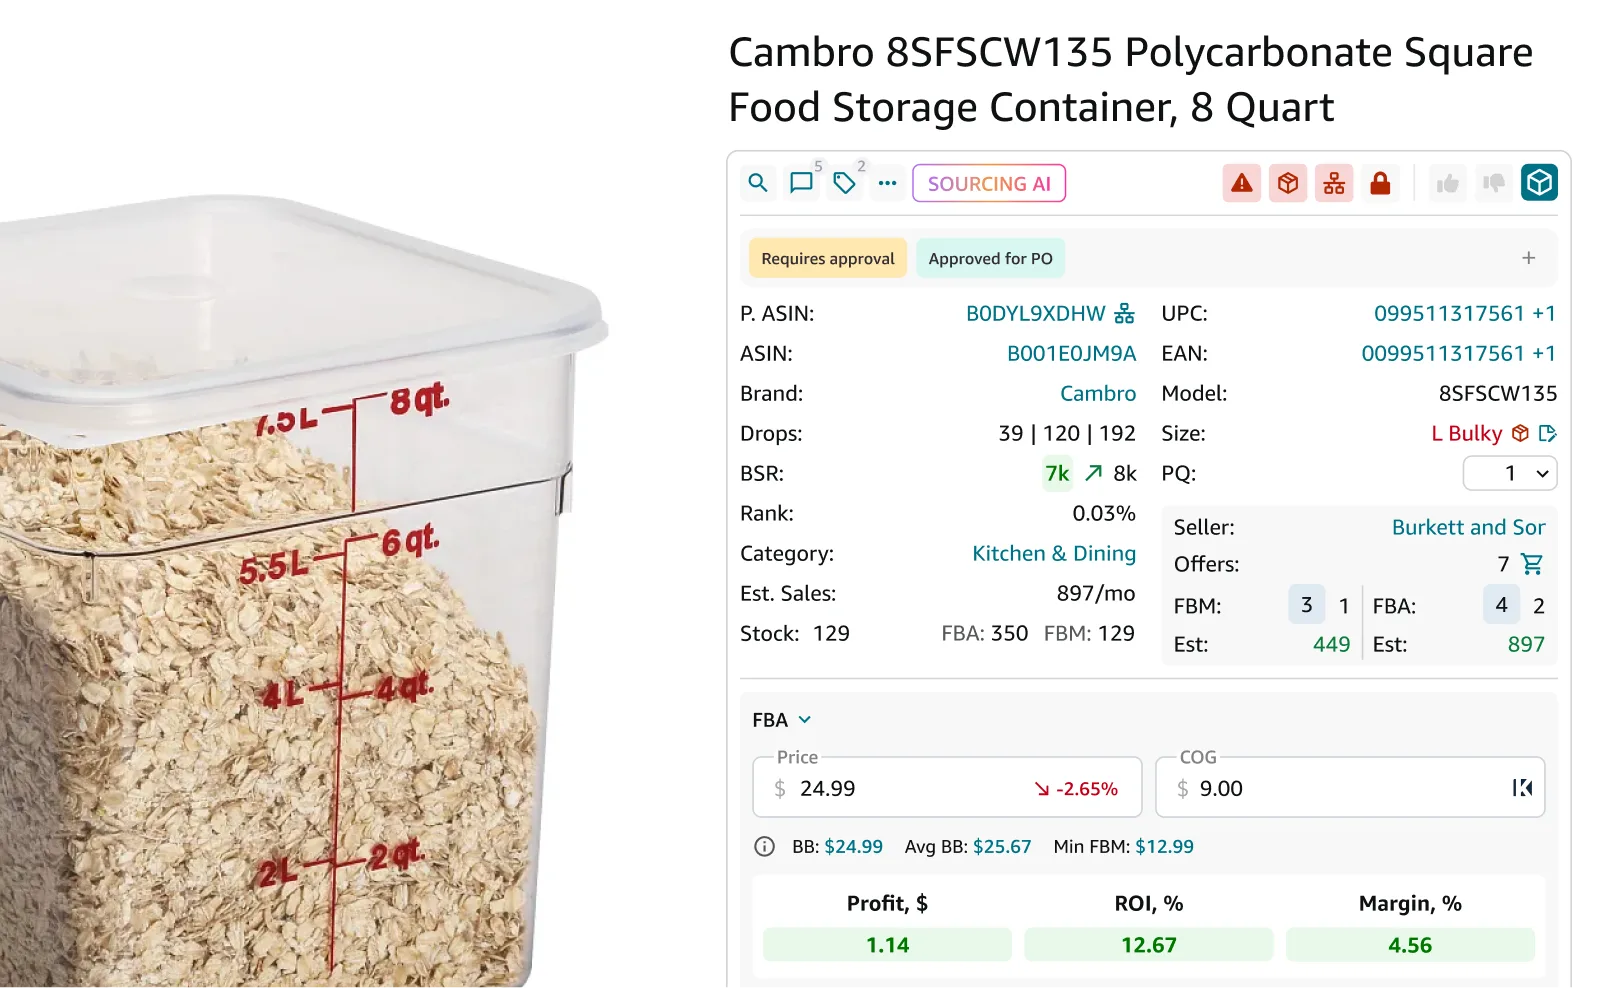
The extension shows profit, restrictions, hazmat and IP flags on the same listing
Three of these checks catch most bad buys. The sales check removes the most products. Half of the supplier lines with 20% ROI or more have no listing that sells 5 units a month. The Buy Box check tells you more than the offer count. The median listing has only 3 offers, but on 49% of the listings with Buy Box history, one seller wins it 80% of the time or more. The price check needs fresh data, because the Buy Box price changed on 3 of every 4 repeat products in a year (42% increased by more than 2%, 33% decreased).
Check eligibility and IP risk before you pay, because a product you cannot list is a loss. About 3 in 10 products in supplier price lists have an IP-risk flag. For a whole price list or brand catalog, the Bulk Restriction Checker checks up to 20,000 ASINs against your account at once and links each gated ASIN to its approval page. See also how to handle restricted brands on Amazon and Amazon IP complaints.
Common Mistakes When You Choose What to Sell
Buying from last year’s sales rank
On the same products, estimated monthly sales decreased by about 2% in a year, and products moved slightly down their category ranks in 16 of 20 categories. The decreases were large in Automotive (−22.8%), Musical Instruments (−21.6%) and Baby (−19.3%). Use current sales, and order a little less than last year’s numbers suggest.
Ignoring supplier price increases
When a supplier changed a price, about 2 of 3 changes were increases, and the usual increase was about +10%. Many leads are only a little above the 20% ROI limit, so a +10% cost increase removes about 24% of them, and a 10% volume discount adds about 29%. In Home & Kitchen, the median supplier cost increased by 5% while selling prices stayed flat, and the margin decreased by 6.1 points. Negotiate the cost of the products you already buy before you add new ones.
FAQ
What is the best thing to sell on Amazon in 2026?
There is no single best product. For resellers, the categories with the most real leads per 1,000 matched supplier lines in Seller Assistant’s Q3 2026 data were Beauty & Personal Care (125), Kitchen & Dining (118) and Clothing, Shoes & Jewelry (110). Grocery & Gourmet Food was the most open category: one seller locks the Buy Box on 38% of its listings, against 49% overall.
What can I sell on Amazon as a new seller?
Start with products that your account can sell without approval, in listings where Amazon does not hold the Buy Box. Online arbitrage needs the least money to start, and wholesale needs supplier accounts but gives you repeat orders. Check eligibility on your own account before you buy a unit.
How much does it cost to sell on Amazon in 2026?
As of October 2026, the Individual plan costs $0.99 per item sold and the Professional plan costs $39.99 a month. Referral fees are 3% to 45% of the price, depending on the category, plus FBA fees if Amazon ships for you. For the median product, Amazon’s fees take about 40% of the sale price.
Did Amazon fees increase in 2026?
Amazon raised US FBA fees by an average of $0.08 per unit on January 15, 2026, and added a fuel surcharge on April 17, 2026. In Seller Assistant’s data, Amazon’s cut of the sale price changed by 0.3 points or less for the median product in 18 of 20 categories. It increased in Books (+1.2 points) and Video Games (+0.8 points).
How do I know if a product will sell on Amazon?
Check the estimated monthly sales, the BSR trend over 90 days and the Buy Box history. In Seller Assistant’s lead definition, the listing must sell at least 5 units a month. Half of the supplier lines with 20% ROI or more fail this check.
Key Takeaways
- Choose the business model first. Wholesale, online arbitrage and private label need different money, carry different risks and get ideas from different sources.
- Only about 41 of every 1,000 supplier lines are real leads (State of Amazon Wholesale, Q3 2026). Beauty & Personal Care, Kitchen & Dining and Clothing give the most, Grocery is the most open, and Books and Baby are the hardest.
- Amazon left many Toys & Games and Video Games listings in 2026, so recheck the products that you rejected because Amazon held the Buy Box.
- Before you buy, check sales (5+ units a month), the Buy Box history, the current price, 20% ROI after fees, eligibility on your account and IP risk.
- Plan for Amazon to keep about 40% of the sale price, and negotiate supplier costs: a 10% discount gives about 29% more leads.