

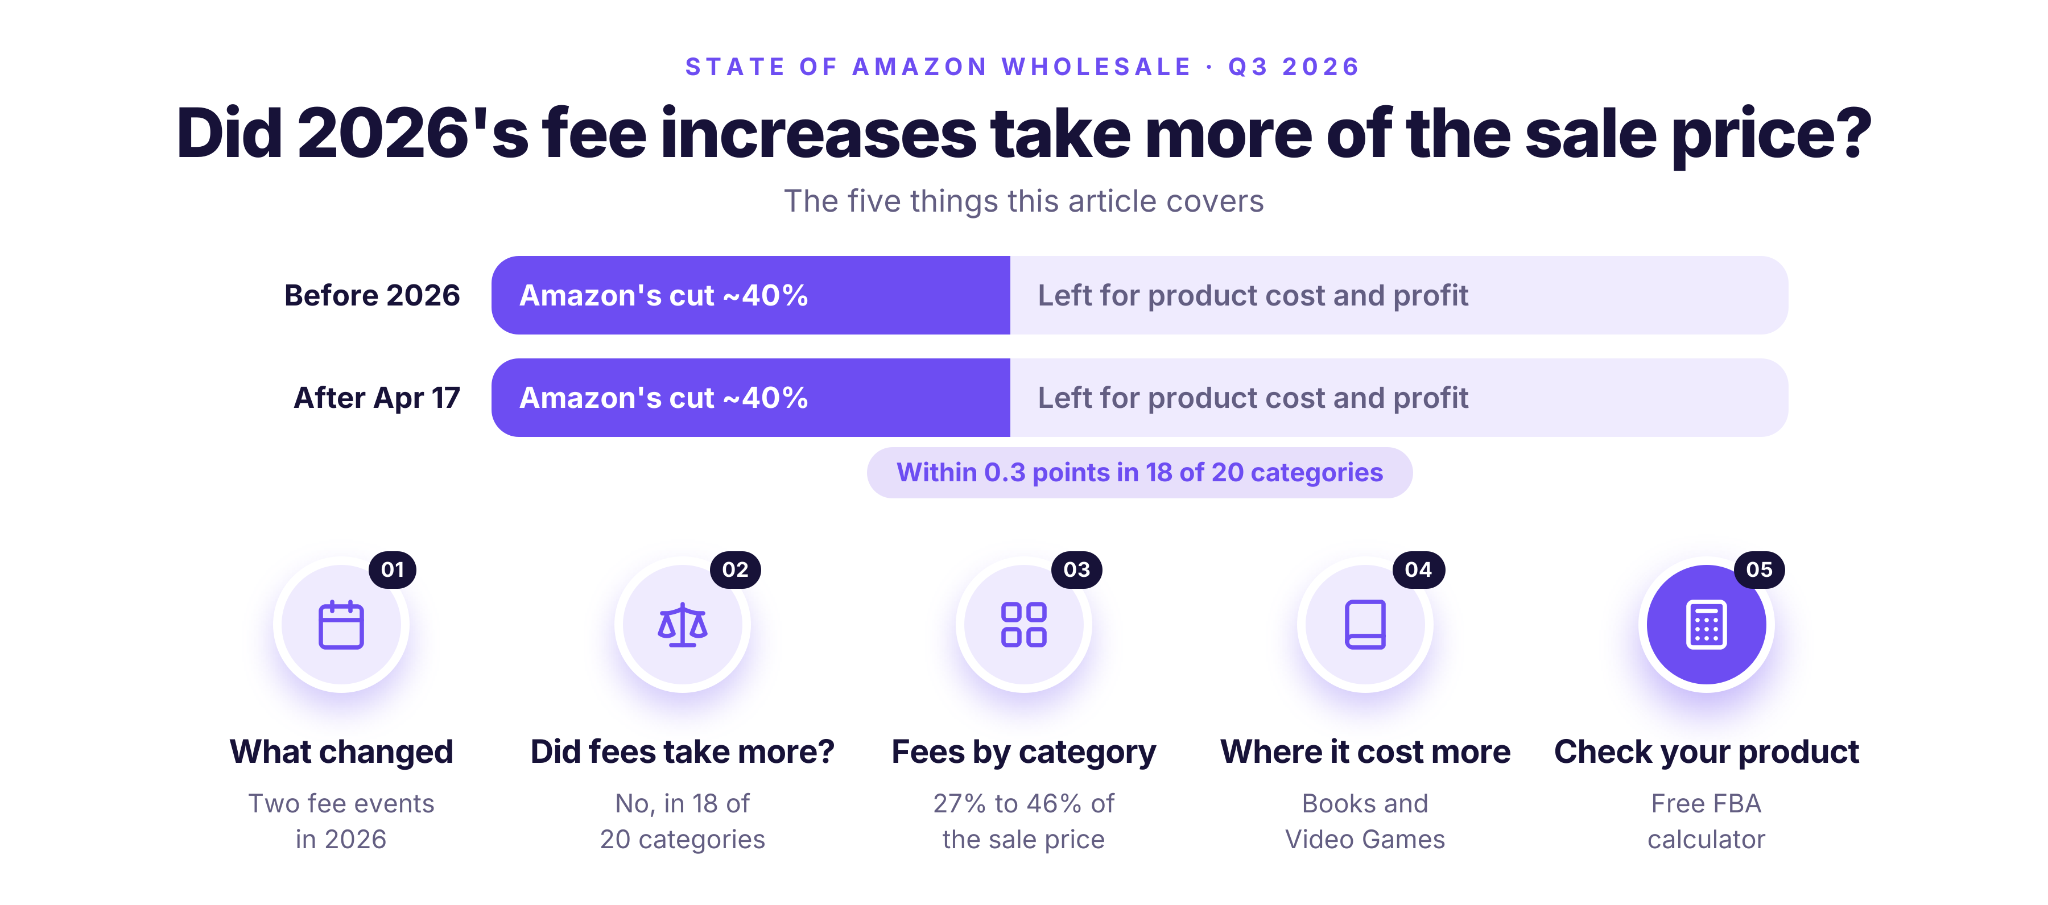
Amazon seller fees by category took almost the same share of the sale price in 2026, even after two fee increases.
According to Seller Assistant’s State of Amazon Wholesale (Q3 2026), Amazon’s cut moved by 0.3 points or less in 18 of 20 categories. Only Books (+1.2 points) and Video Games (+0.8 points) rose. Amazon keeps about 40% of each sale.
| About This Data | Details |
|---|---|
| Source | Seller Assistant, The State of Amazon Wholesale, Q3 2026. Figures are estimates from anonymized Seller Assistant data and third-party market data. Amazon did not supply or endorse the report. |
| Period and marketplace | July 2025 – August 2026, Amazon.com (US). The report covers 13.5 million supplier lines from 782 verified wholesale sellers. |
| Fee events compared | The Jan 15, 2026 fee schedule change and the Apr 17, 2026 fuel surcharge. |
| Sample: Amazon’s cut | The same products measured before Jan 1, 2026 and after Apr 17, 2026: about 335,000 product pairs across 20 categories. Comparing the same products separates the fee change from changes in product mix. |
| Sample: cross-check and margins | 59,828 same-seller, same-product pairs from 16 sellers active in both H2 2025 and 2026. This panel shows the same result for Amazon’s cut (–0.29 points) and provides the margin figures. It is small, so its category figures show direction only. |
What Changed in Amazon FFA Fees in 2026?
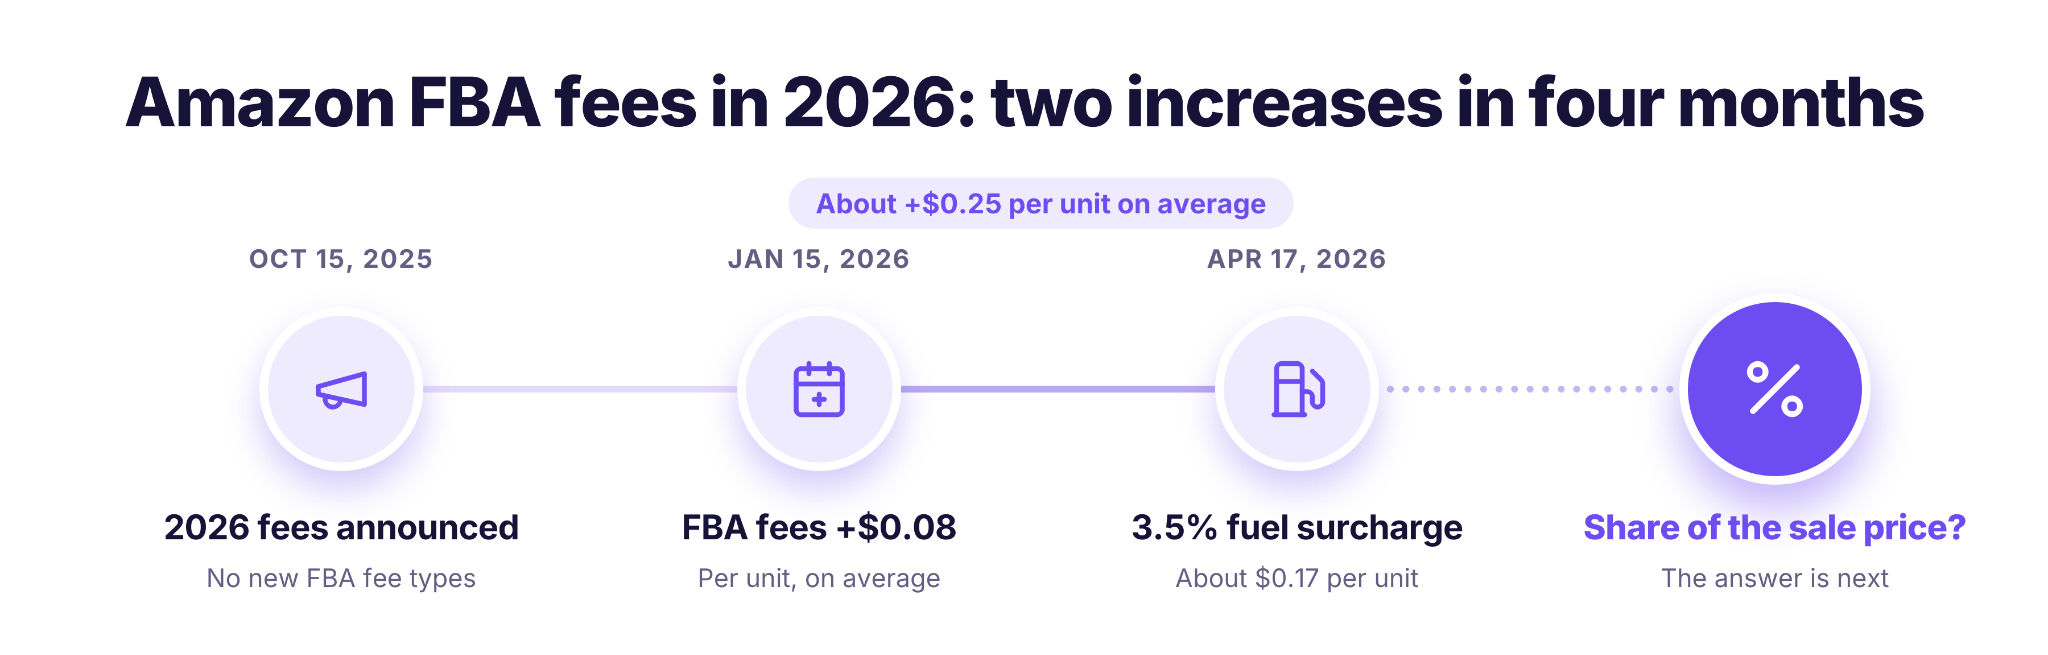
Amazon FBA fees in 2026 went up twice in four months. The first increase came with the annual fee update on January 15, and the second came as a fuel surcharge on April 17.
- January 15: the annual fee update
Amazon announced its 2026 fee changes in October 2025. FBA fulfillment fees rose by an average of $0.08 per unit, which Amazon put at under 0.5% of an average item’s selling price. There was no increase in 2025, and Amazon said it wouldn’t add any new FBA fee types. Referral fee percentages stayed largely the same.
- April 17: the fuel and logistics surcharge
Amazon added a 3.5% surcharge to FBA fulfillment fees in the US and Canada, citing higher fuel and logistics costs. The surcharge is a percentage of the fulfillment fee and averages about $0.17 per unit in the US. Amazon calls it temporary. A similar 5% surcharge in 2022 was later built into standard FBA fees.
Together, that’s an Amazon seller fee increase of about $0.25 per unit on average, before storage and inventory fees. Other fees changed too, including low-inventory and aged-inventory fees, but these sit outside the referral and FBA fees measured in this post.
Takeaway
For your margins, the share of the sale price Amazon keeps matters more than the cents per unit.
Did the Amazon Seller Fee Increase Take More of the Sale Price?
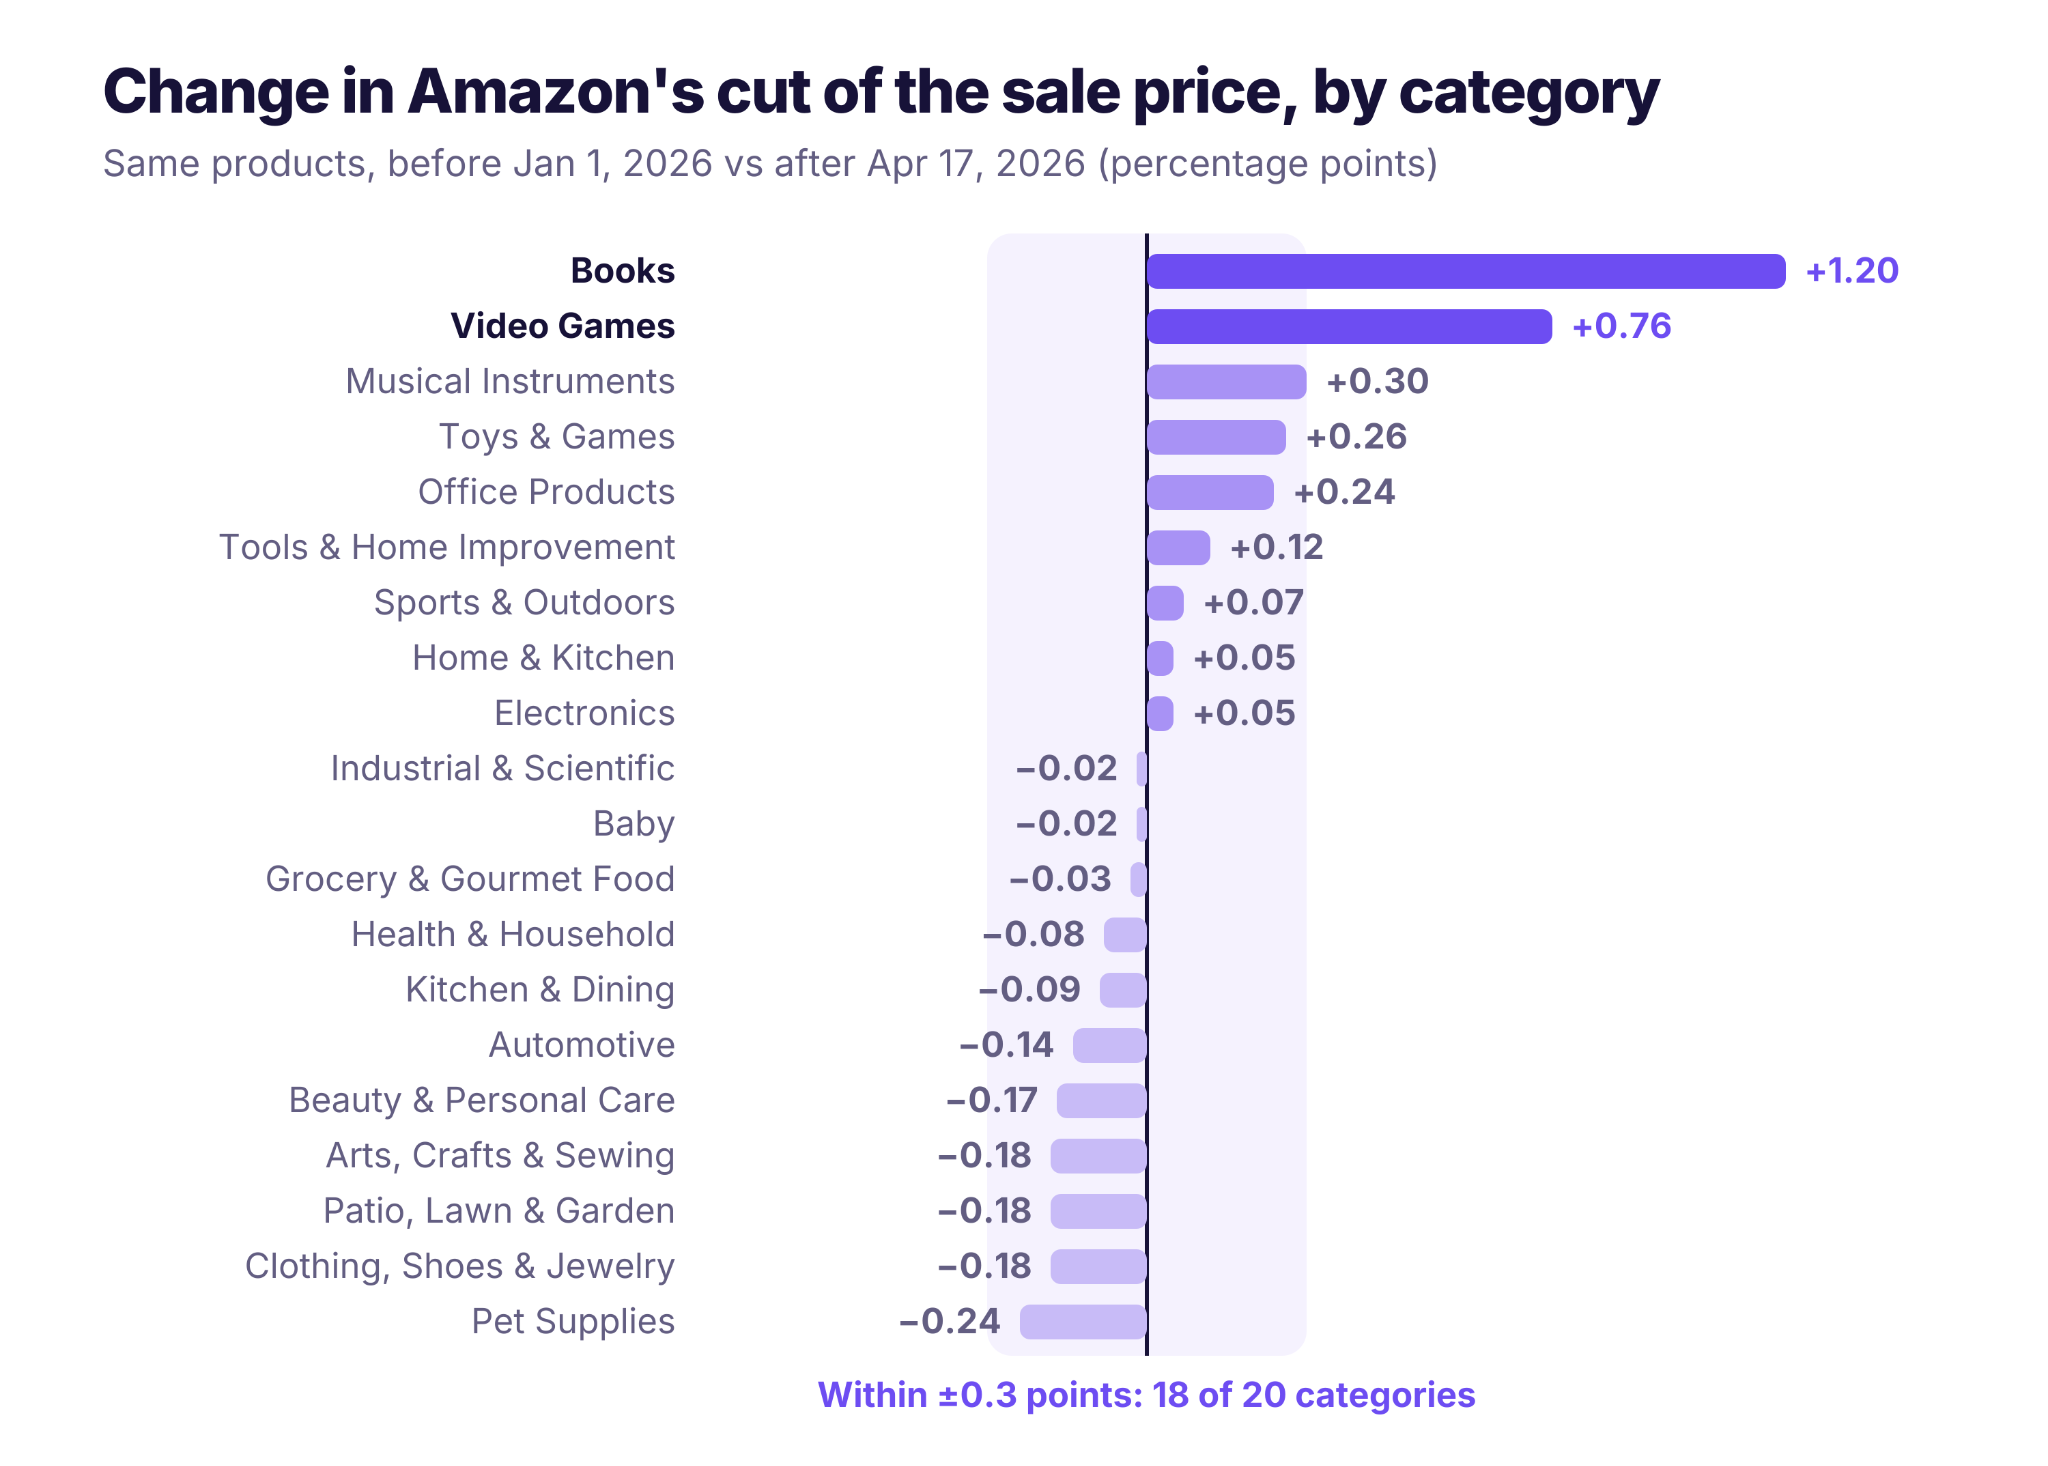
Amazon’s cut of the sale price barely moved in 2026: on the same products, it stayed at about 40% before and after both fee increases. According to Seller Assistant’s State of Amazon Wholesale (Q3 2026), Amazon’s cut changed by 0.3 points or less in 18 of 20 categories after the January fee update and the April fuel surcharge.
What the data shows
The report compares the same products before January 1, 2026 and after April 17, 2026, so a change in product mix can’t distort the result. In 11 categories Amazon’s cut went down slightly, and in 7 it rose by 0.3 points or less. Only two categories moved noticeably: Books (+1.2 points) and Video Games (+0.8 points). A separate panel of the same sellers buying the same products shows the same thing overall: −0.29 points.
Why higher fees didn’t mean a bigger cut
The increases were small next to the sale price. Amazon itself put the January FBA increase at under 0.5% of an average item’s price, and the fuel surcharge applies to the fulfillment fee, not the full price. At the same time, Buy Box prices on repeat products rose about 2.4% on average. Because Amazon’s cut is measured as a share of the price, small fee increases and slightly higher prices left the share almost where it was.
Why your own fee share may still jump
If you track Amazon fees as a share of revenue month by month, expect swings. The report’s monthly median moves between 39% and 45%, and those swings come from changes in which products sell. A month heavy on low-price items will always show a higher fee share. To see what fees really did, compare the same products over time instead of your monthly totals.
What Are Amazon Seller Fees by Category in 2026?
Amazon seller fees by category take between about 27% and 46% of the sale price, and about 40% for the median product. According to Seller Assistant’s State of Amazon Wholesale (Q3 2026), Amazon’s cut after April 17, 2026 ranges from 27.6% in Video Games to 46.1% in Arts, Crafts & Sewing.
| Category | Amazon’s Cut, Before Jan 1, 2026 | Amazon’s Cut, After Apr 17, 2026 | Change (Points) |
|---|---|---|---|
| Arts, Crafts & Sewing | 46.6% | 46.1% | −0.18 |
| Pet Supplies | 45.9% | 45.6% | −0.24 |
| Baby | 45.9% | 45.4% | −0.02 |
| Grocery & Gourmet Food | 45.3% | 45.3% | −0.03 |
| Books | 42.3% | 43.7% | +1.20 |
| Patio, Lawn & Garden | 43.8% | 43.6% | −0.18 |
| Kitchen & Dining | 43.4% | 43.0% | −0.09 |
| Industrial & Scientific | 42.2% | 42.0% | −0.02 |
| Home & Kitchen | 41.0% | 41.4% | +0.05 |
| Toys & Games | 41.2% | 41.0% | +0.26 |
| Office Products | 40.0% | 40.5% | +0.24 |
| Health & Household | 40.4% | 40.1% | −0.08 |
| Tools & Home Improvement | 39.7% | 40.0% | +0.12 |
| Beauty & Personal Care | 39.5% | 39.1% | −0.17 |
| Automotive | 34.8% | 34.2% | −0.14 |
| Clothing, Shoes & Jewelry | 33.9% | 33.8% | −0.18 |
| Sports & Outdoors | 30.5% | 30.6% | +0.07 |
| Electronics | 30.6% | 30.4% | +0.05 |
| Musical Instruments | 28.8% | 29.1% | +0.30 |
| Video Games | 26.7% | 27.6% | +0.76 |
Median referral fee plus FBA fee as a share of the Buy Box price, on the same products in both periods. The change column is the median of each product’s own change, so it can differ from the gap between the two medians.
How to read the table
Each figure is what Amazon keeps from a sale through two fees: the referral fee and the FBA fulfillment fee. It’s measured before you pay for the product, and it doesn’t include storage, inbound placement, returns or advertising. The table is sorted by the current share, so the categories where Amazon takes the most are at the top.
Where Amazon takes the most
Arts, Crafts & Sewing, Pet Supplies, Baby and Grocery & Gourmet Food all sit at about 45–46%. In these categories, less than 55% of the sale price is left to cover the product, prep, freight and profit.
Where Amazon takes the least
Video Games (27.6%), Musical Instruments (29.1%), Electronics (30.4%) and Sports & Outdoors (30.6%) have the lowest cut. A low cut doesn’t mean more leads. Electronics keeps Amazon’s share near 30% and gives only 22.5 leads per 1,000 matched supplier lines, one of the lowest rates in the report.
Why the share differs by category
Two things drive the gap. Referral fees are a percentage of the price and differ by category. The FBA fee is a fixed amount per unit based on size and weight, so it takes a bigger share of cheap or bulky items than of expensive, compact ones.
Amazon referral fees by category vs. Amazon’s cut
Amazon referral fees by category are a published percentage, mostly between 8% and 15%. Amazon’s cut in this table is that referral fee plus the FBA fee, as a share of the price. For the current referral rate in each category, see our guide to Amazon FBA fees.
What this means for your calculations
Use your category’s share, not a flat 40%. Calculating a Pet Supplies product at 40% instead of 45.6% overstates what’s left for you by more than 5 points of the sale price.
Which Categories Got More Expensive, And Where Did Margins Slip?
Only two categories got noticeably more expensive in 2026, and both are media: Books, where Amazon’s cut rose by 1.2 points, and Video Games, where it rose by 0.8 points. Margins slipped across the market because of supplier costs. Amazon fees barely moved them.
Books and Video Games: recalculate your margins
In Books, Amazon’s cut went from 42.3% to 43.7% of the sale price. That increase lands on the hardest category in the report: only about 21% of Books items break even for the median seller, 64% of measurable listings are locked by one seller, and Amazon holds the Buy Box on about half of them.
In Video Games, the cut went from 26.7% to 27.6%. It’s still the lowest share of any category, and Amazon left Video Games listings faster than any other category this year (−6.7 points of Buy Box share), so more listings are open to third-party sellers.
Takeaway
If you sell in either category, recalculate your current products with the new fees rather than relying on last year’s numbers.
Margins slipped because of supplier costs
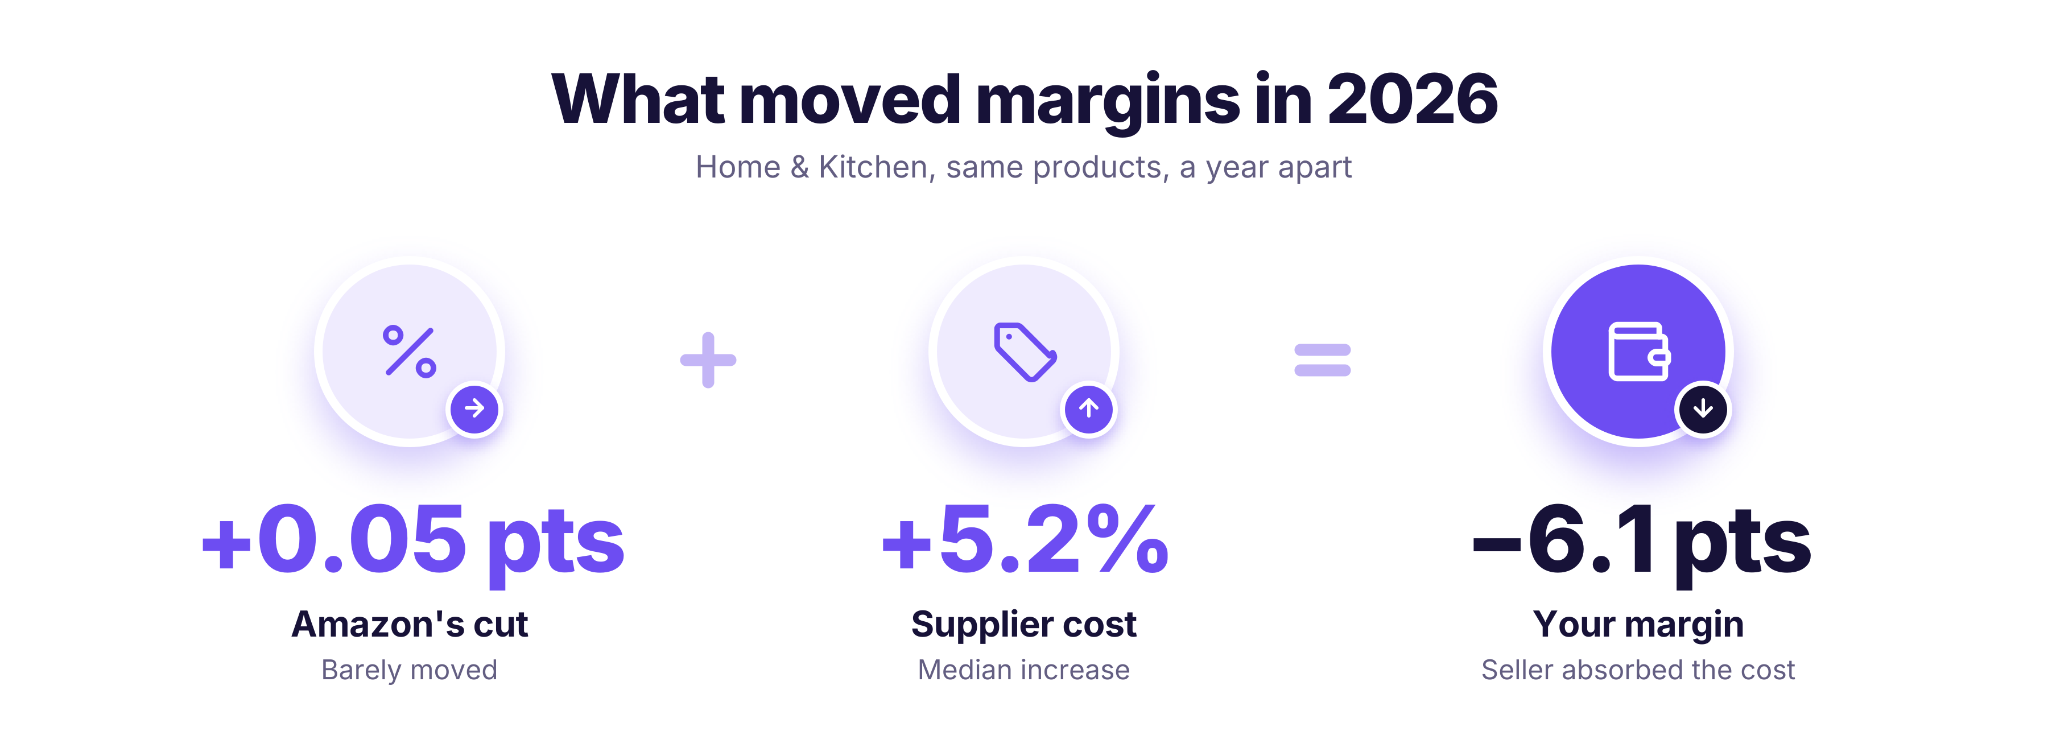
On the same products, the median margin changed by only −0.08 points, and the average by −0.7 points. But 45% of products lost more than a point. Those losses came from supplier prices. In Home & Kitchen, the median supplier cost rose 5.2% and margins fell 6.1 points, while Amazon’s cut in the category barely moved (+0.05 points).
According to Seller Assistant’s State of Amazon Wholesale (Q3 2026), supplier prices had more effect on margins than Amazon fees in 2026.
For how supplier increases cut your leads, see how a supplier price increase cuts your Amazon leads. For how to calculate margin per product, see our Amazon profit margin guide.
How Do You Check Amazon Fees on Your Own Product?
The category table gives you a benchmark, but the fees on your own product depend on its size, weight and price, so check them one ASIN at a time. The free Seller Assistant’s Amazon FBA Calculator shows every Amazon fee on a single product.
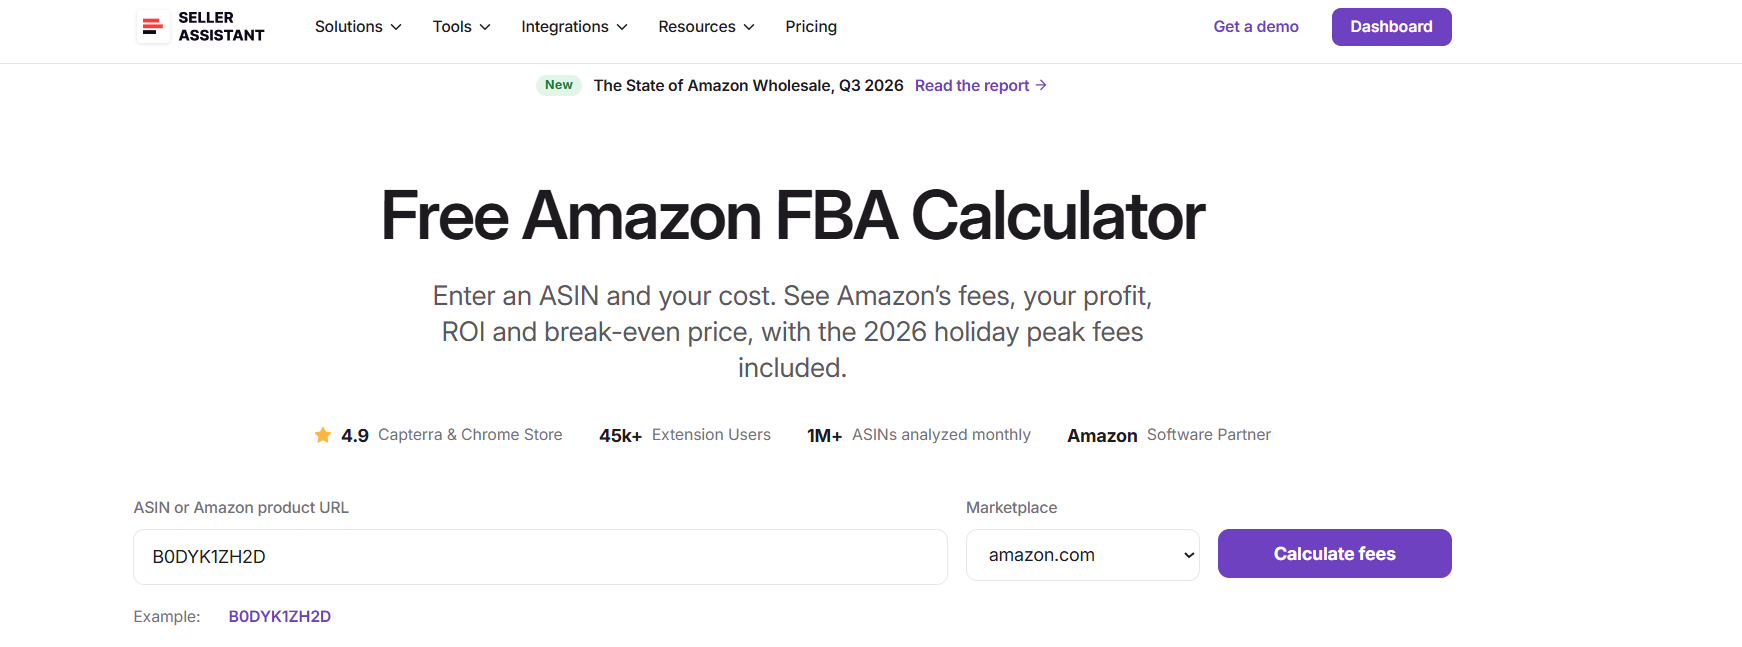
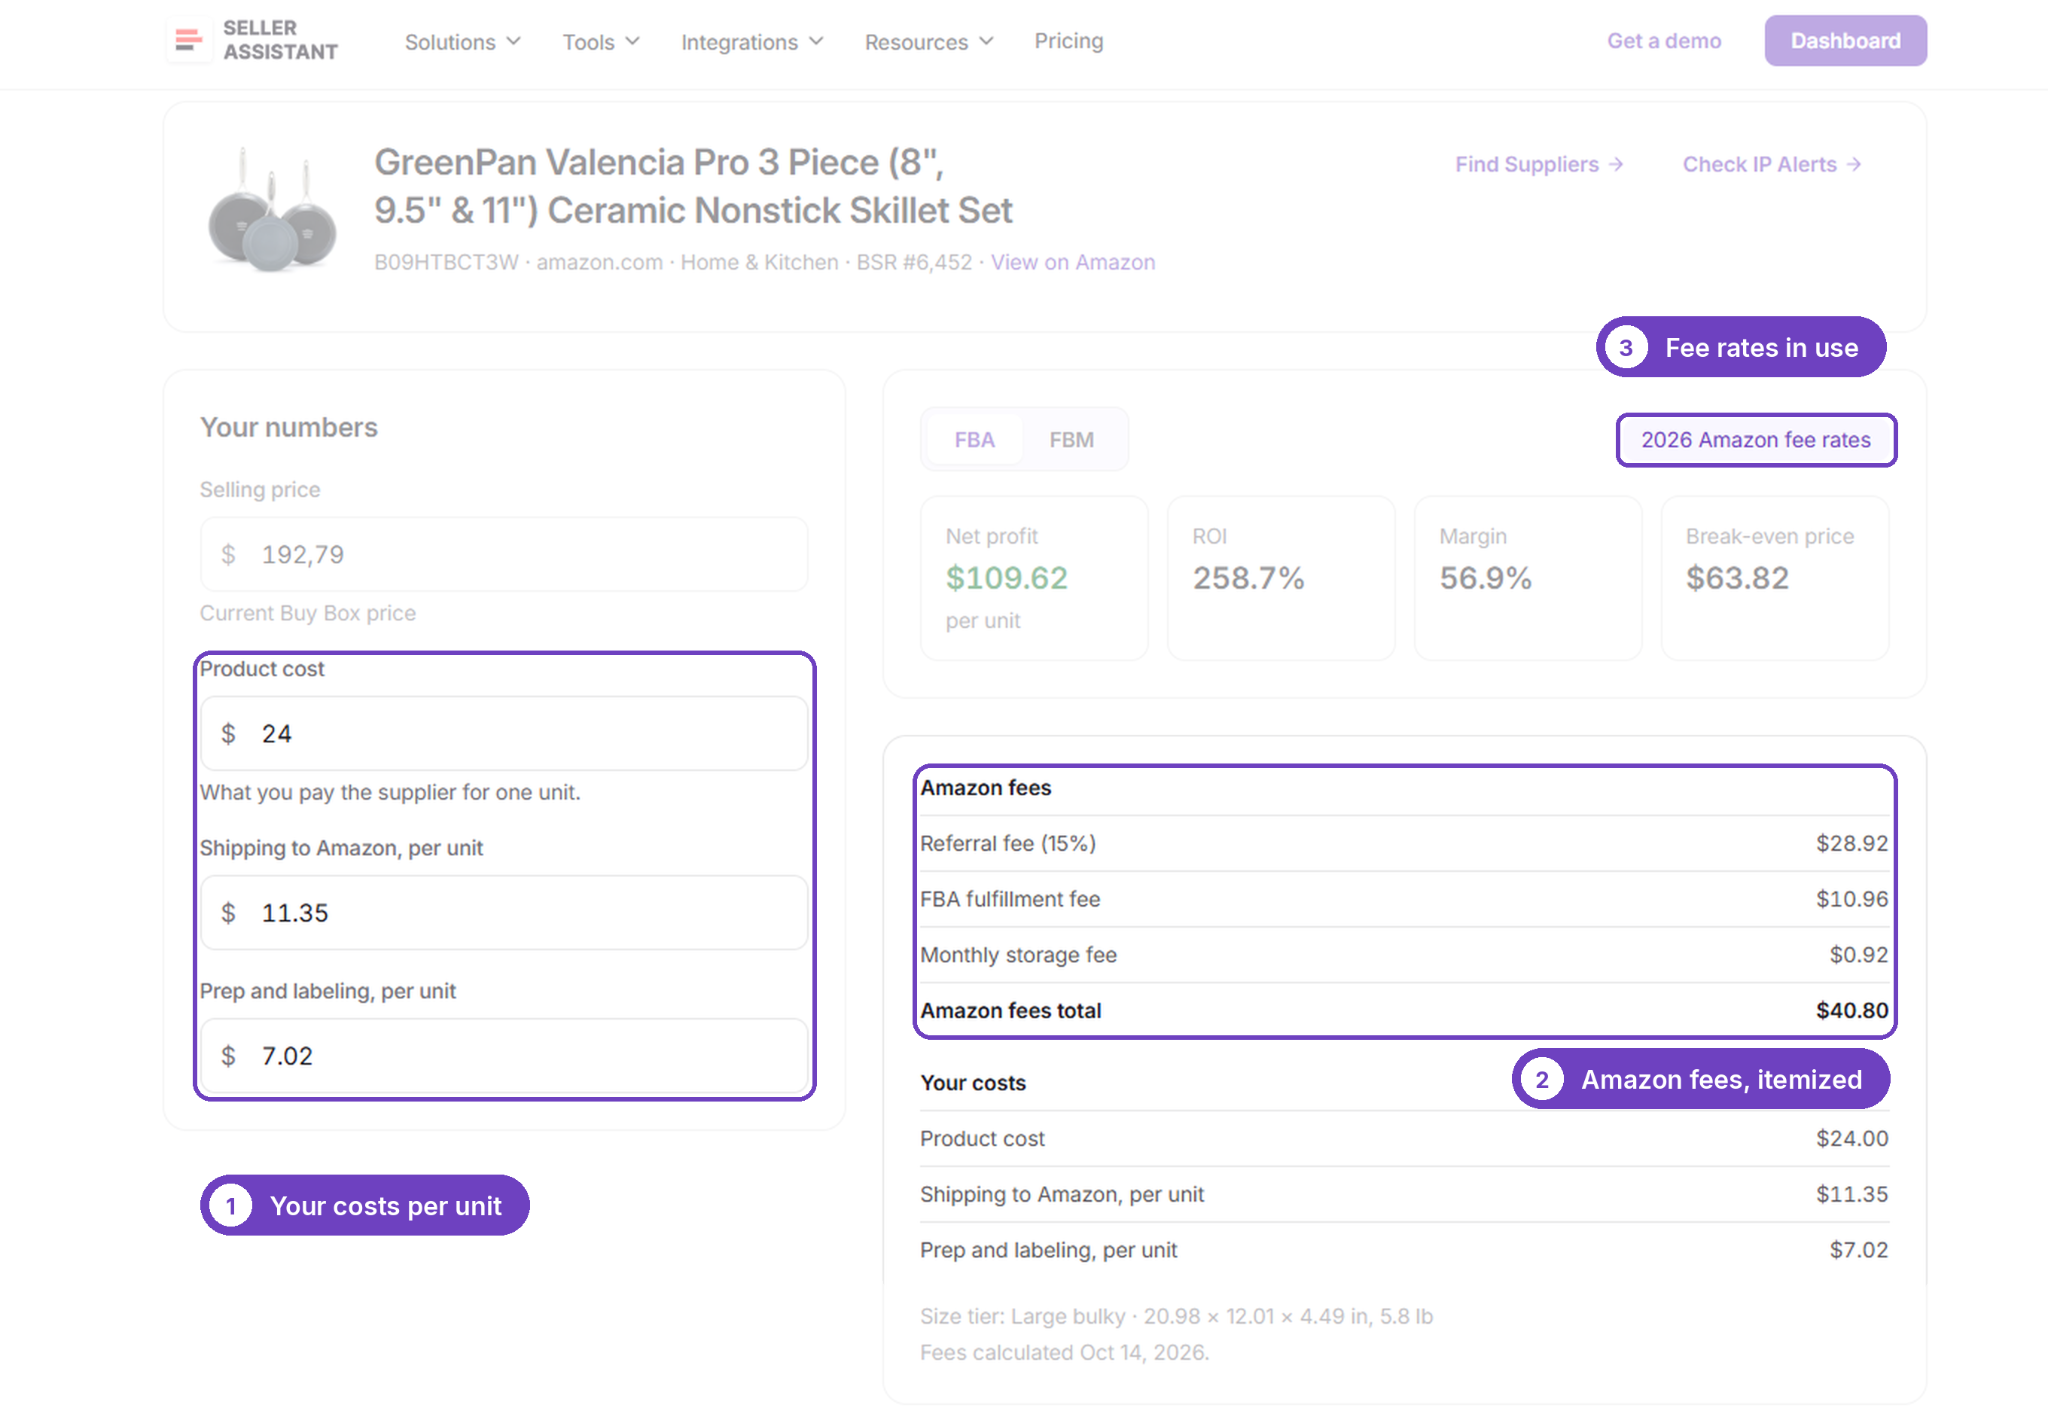
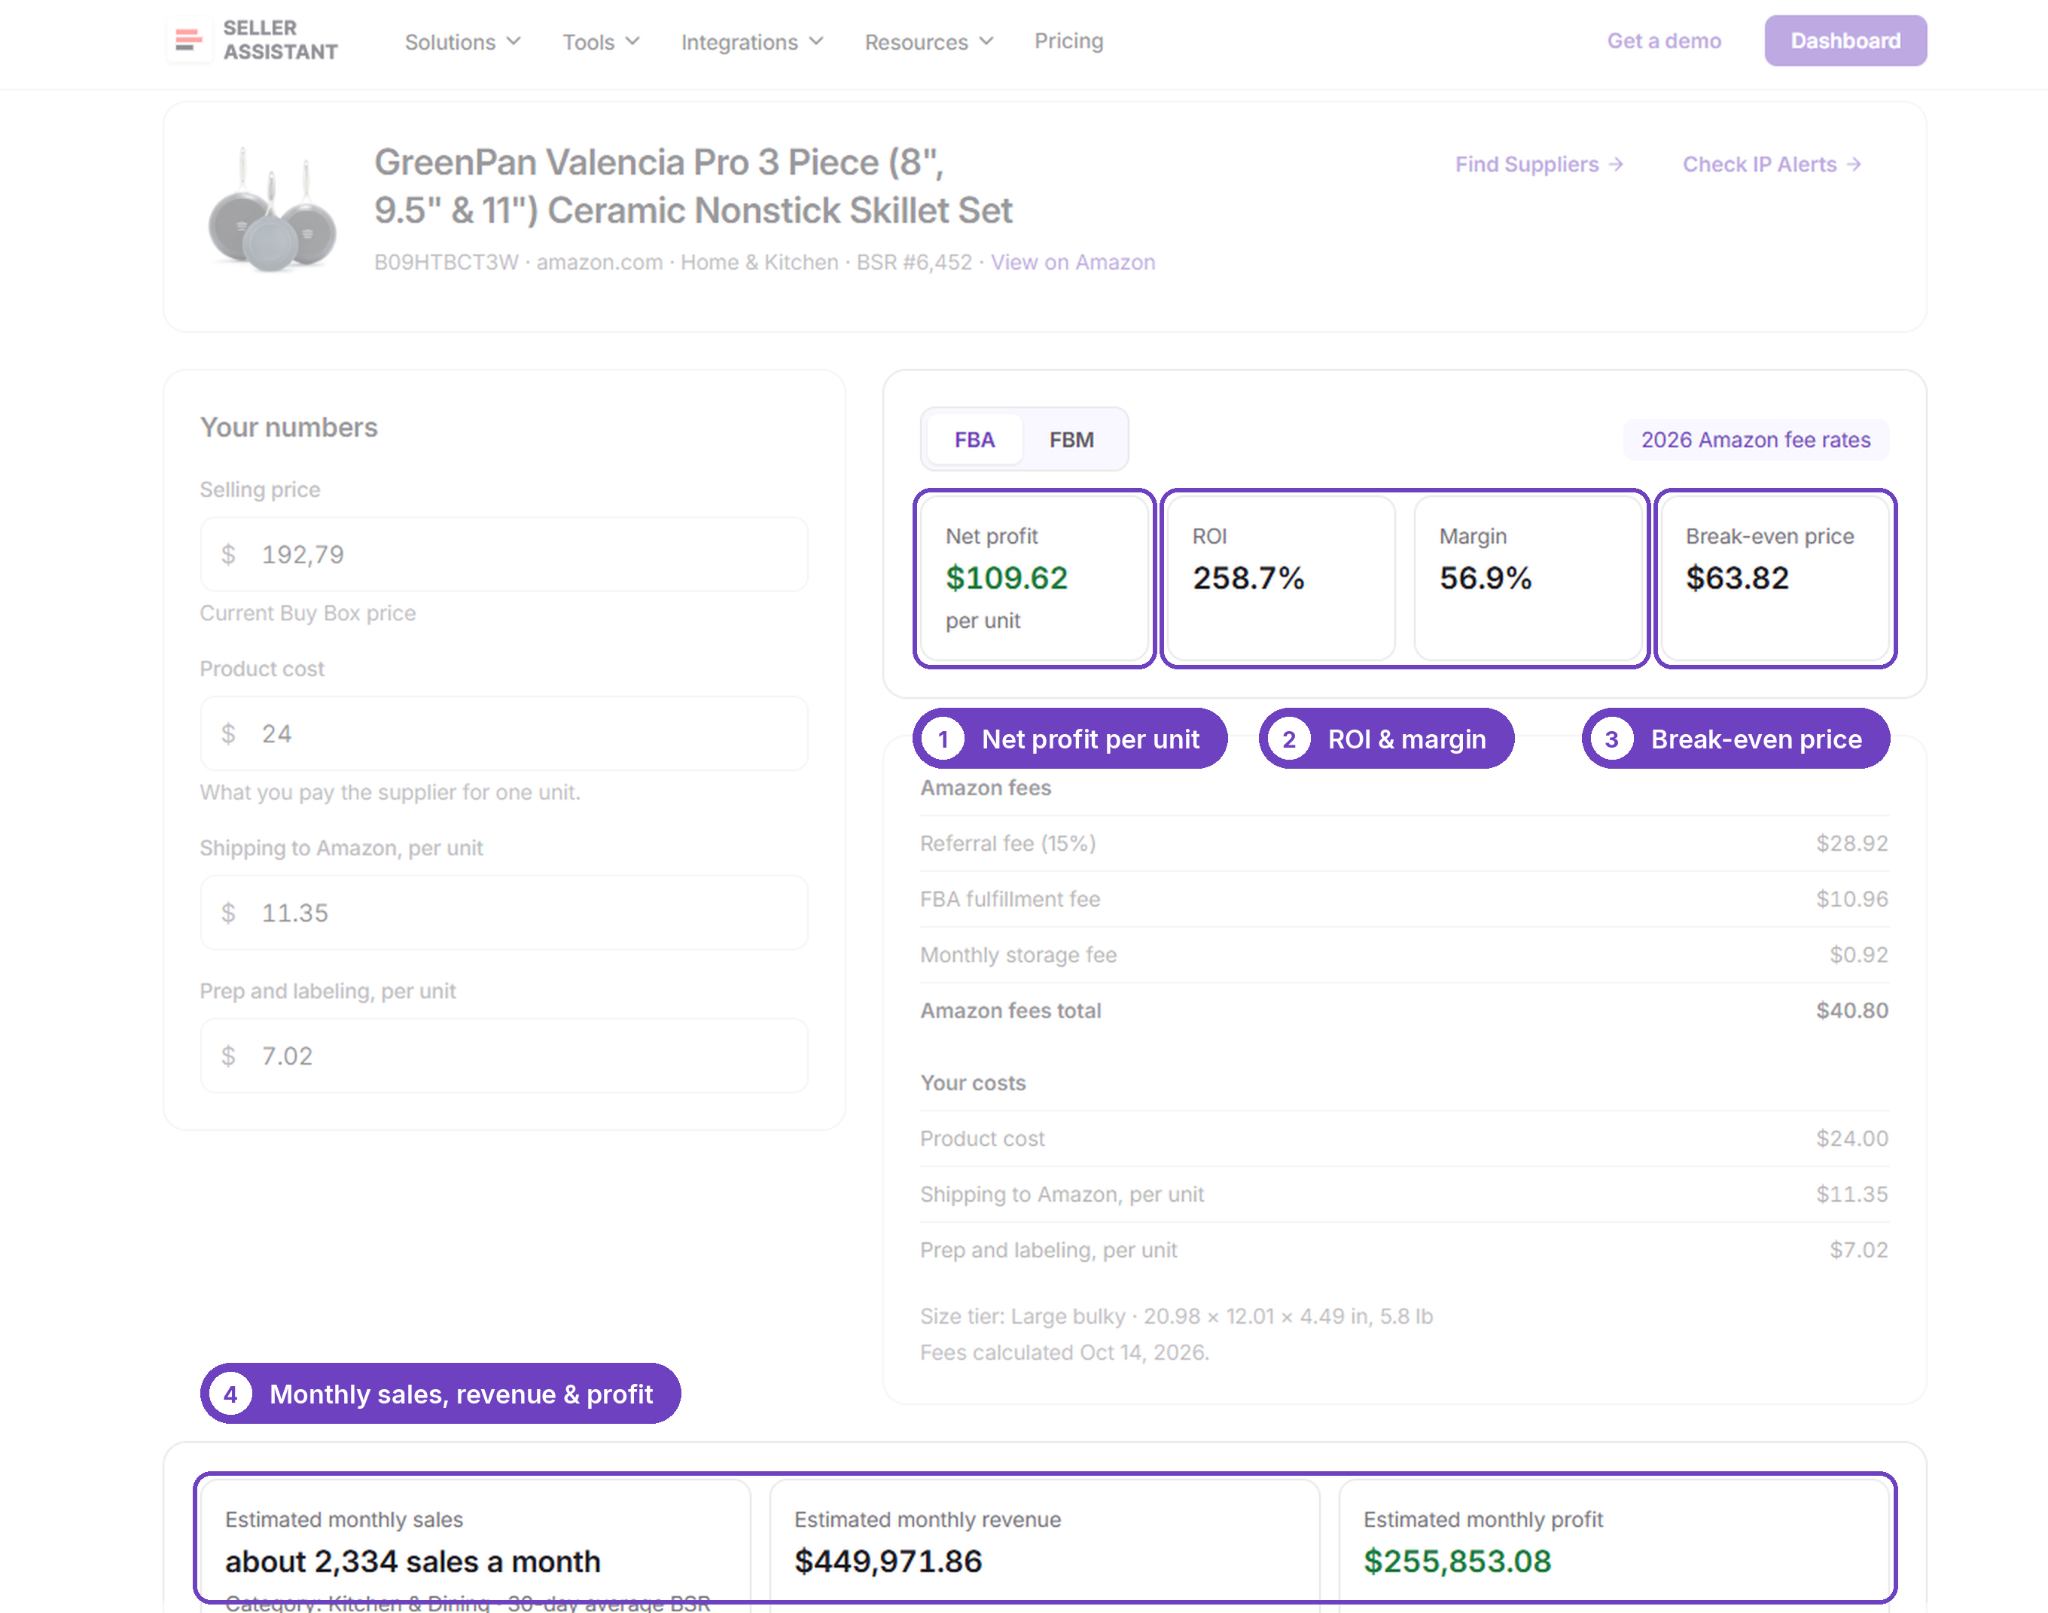
Enter an ASIN and your cost to see the referral fee, the FBA fulfillment fee with the 2026 fuel surcharge included, and the storage fee, along with your profit, ROI, margin and break-even price. It’s free and doesn’t need an account.
What you can do with the free Amazon FBA Calculator
- Estimate potential FBA profit
See the profit left from a sale after Amazon fees and your costs.
- Check return on investment
Compare estimated profit with your purchasing costs to see whether a product meets your target ROI.
- Evaluate profit margins
See what share of the expected selling price remains as profit after expenses.
- See every Amazon fee
Referral and FBA fulfillment fees are included, so you don’t evaluate products on revenue alone.
- Factor in sourcing expenses
Add product cost and other expenses to the calculation.
- Compare selling prices
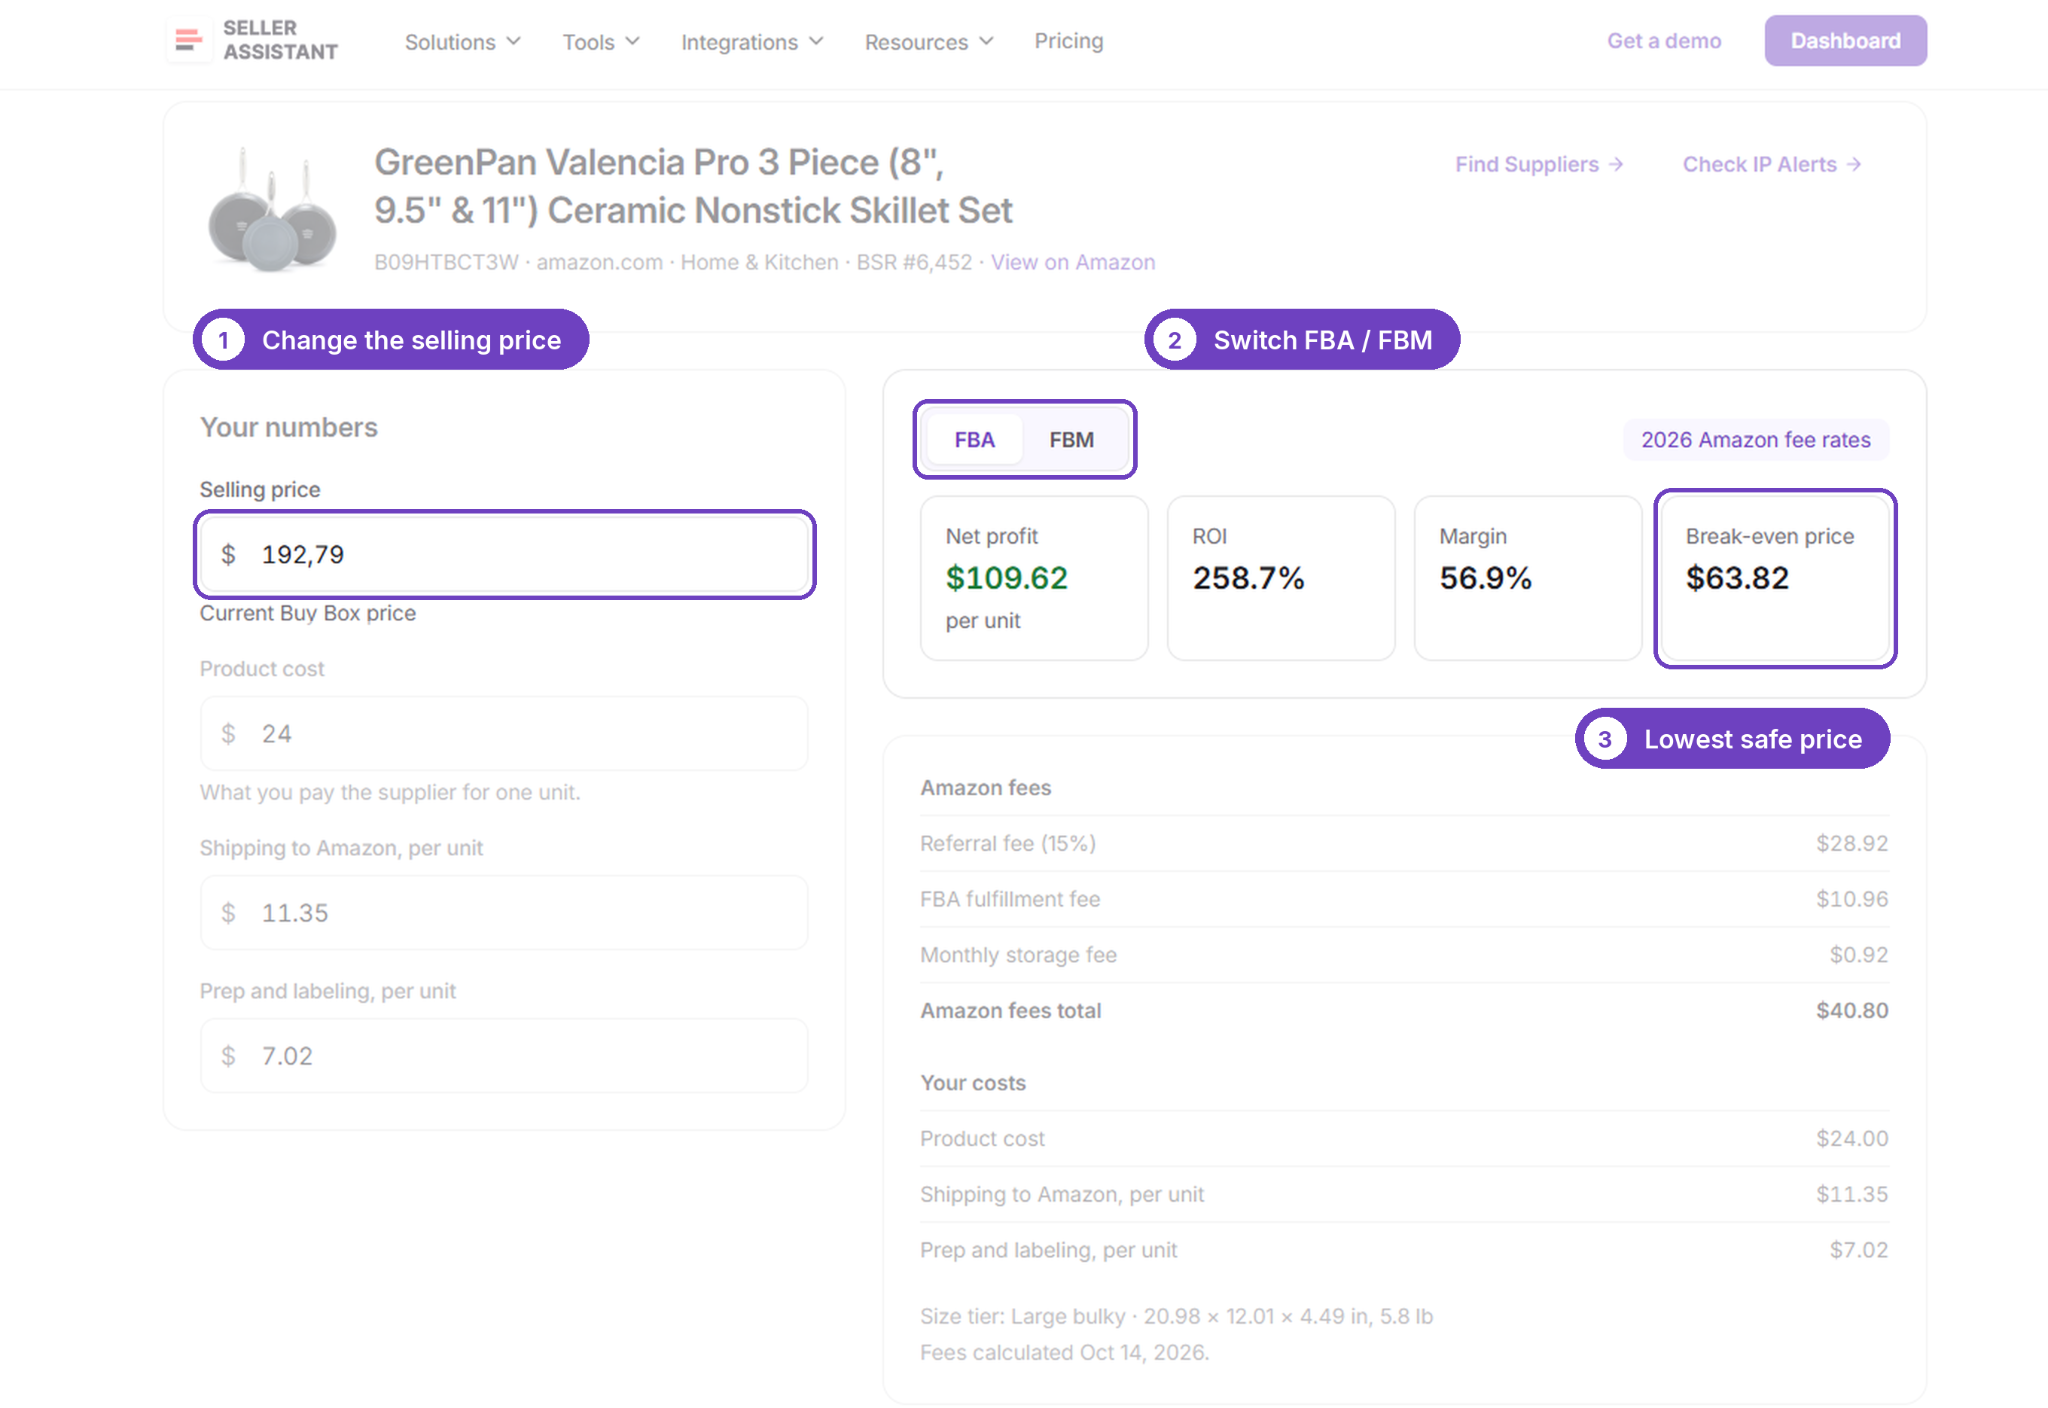
Test different expected Amazon prices to understand how price changes affect profit, ROI, and margin.
- Review individual products before purchasing
Use the results to decide whether a product deserves further research or should be removed from your sourcing shortlist.
How to use free Amazon FBA Calculator in steps
Step 1. Open the calculator
Go to free Seller Assistant’s Amazon FBA Calculator and open the calculation form.
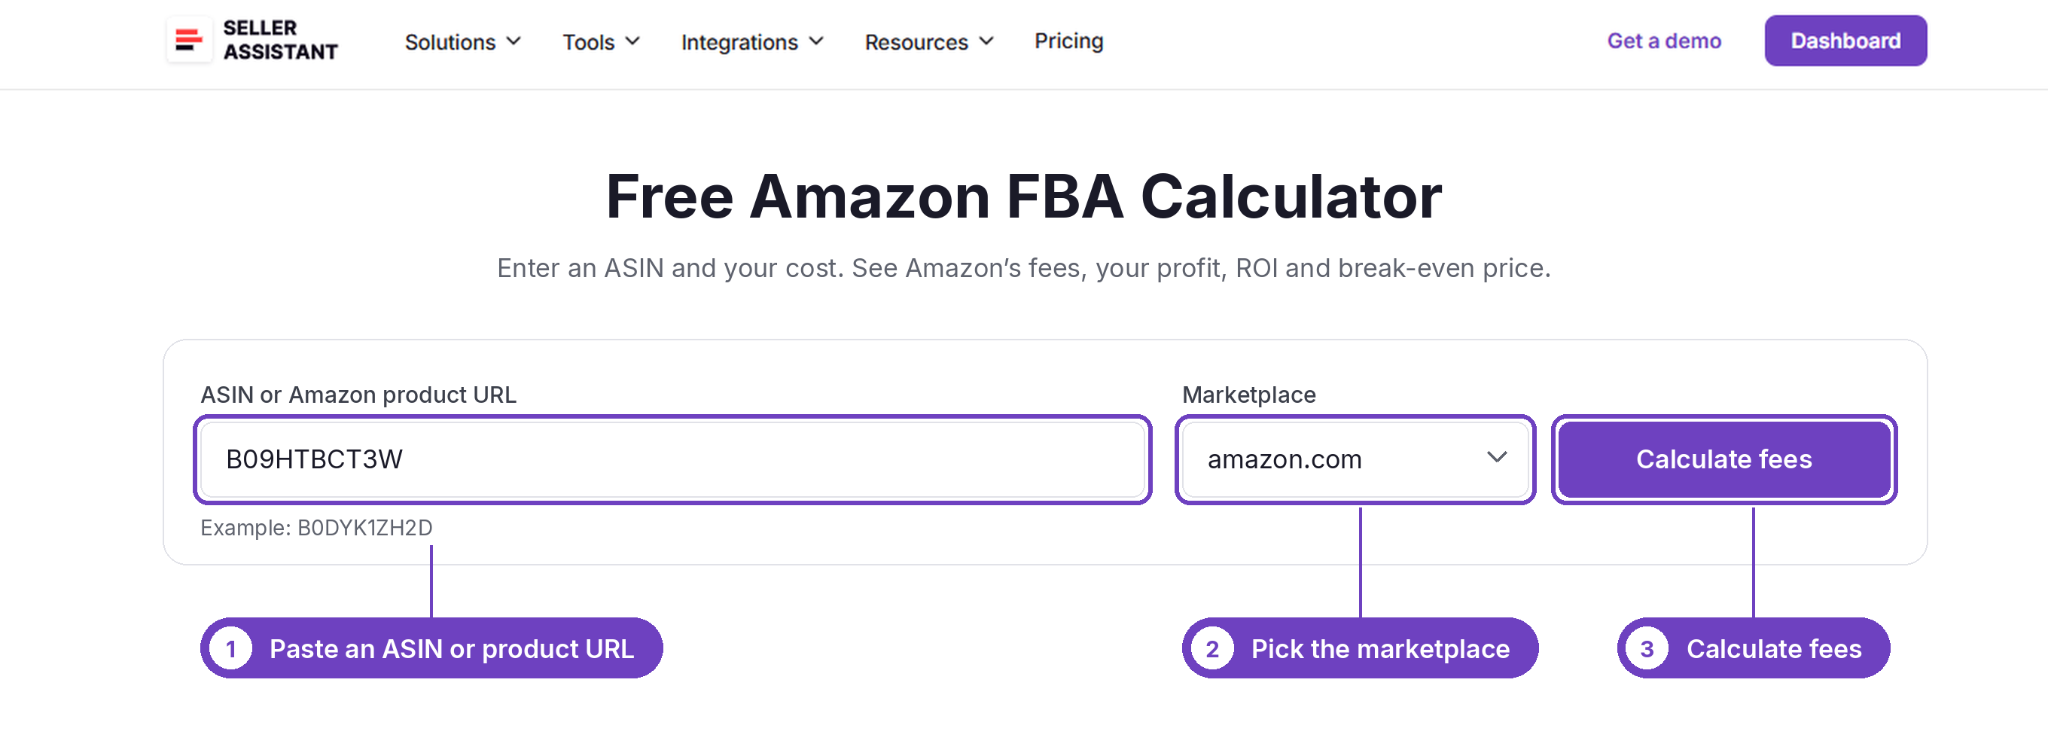
Step 2. Enter the product information
Provide the product details requested by the calculator. Make sure you’re evaluating the correct Amazon product and package configuration, since differences in size or quantity can affect the estimated fees.
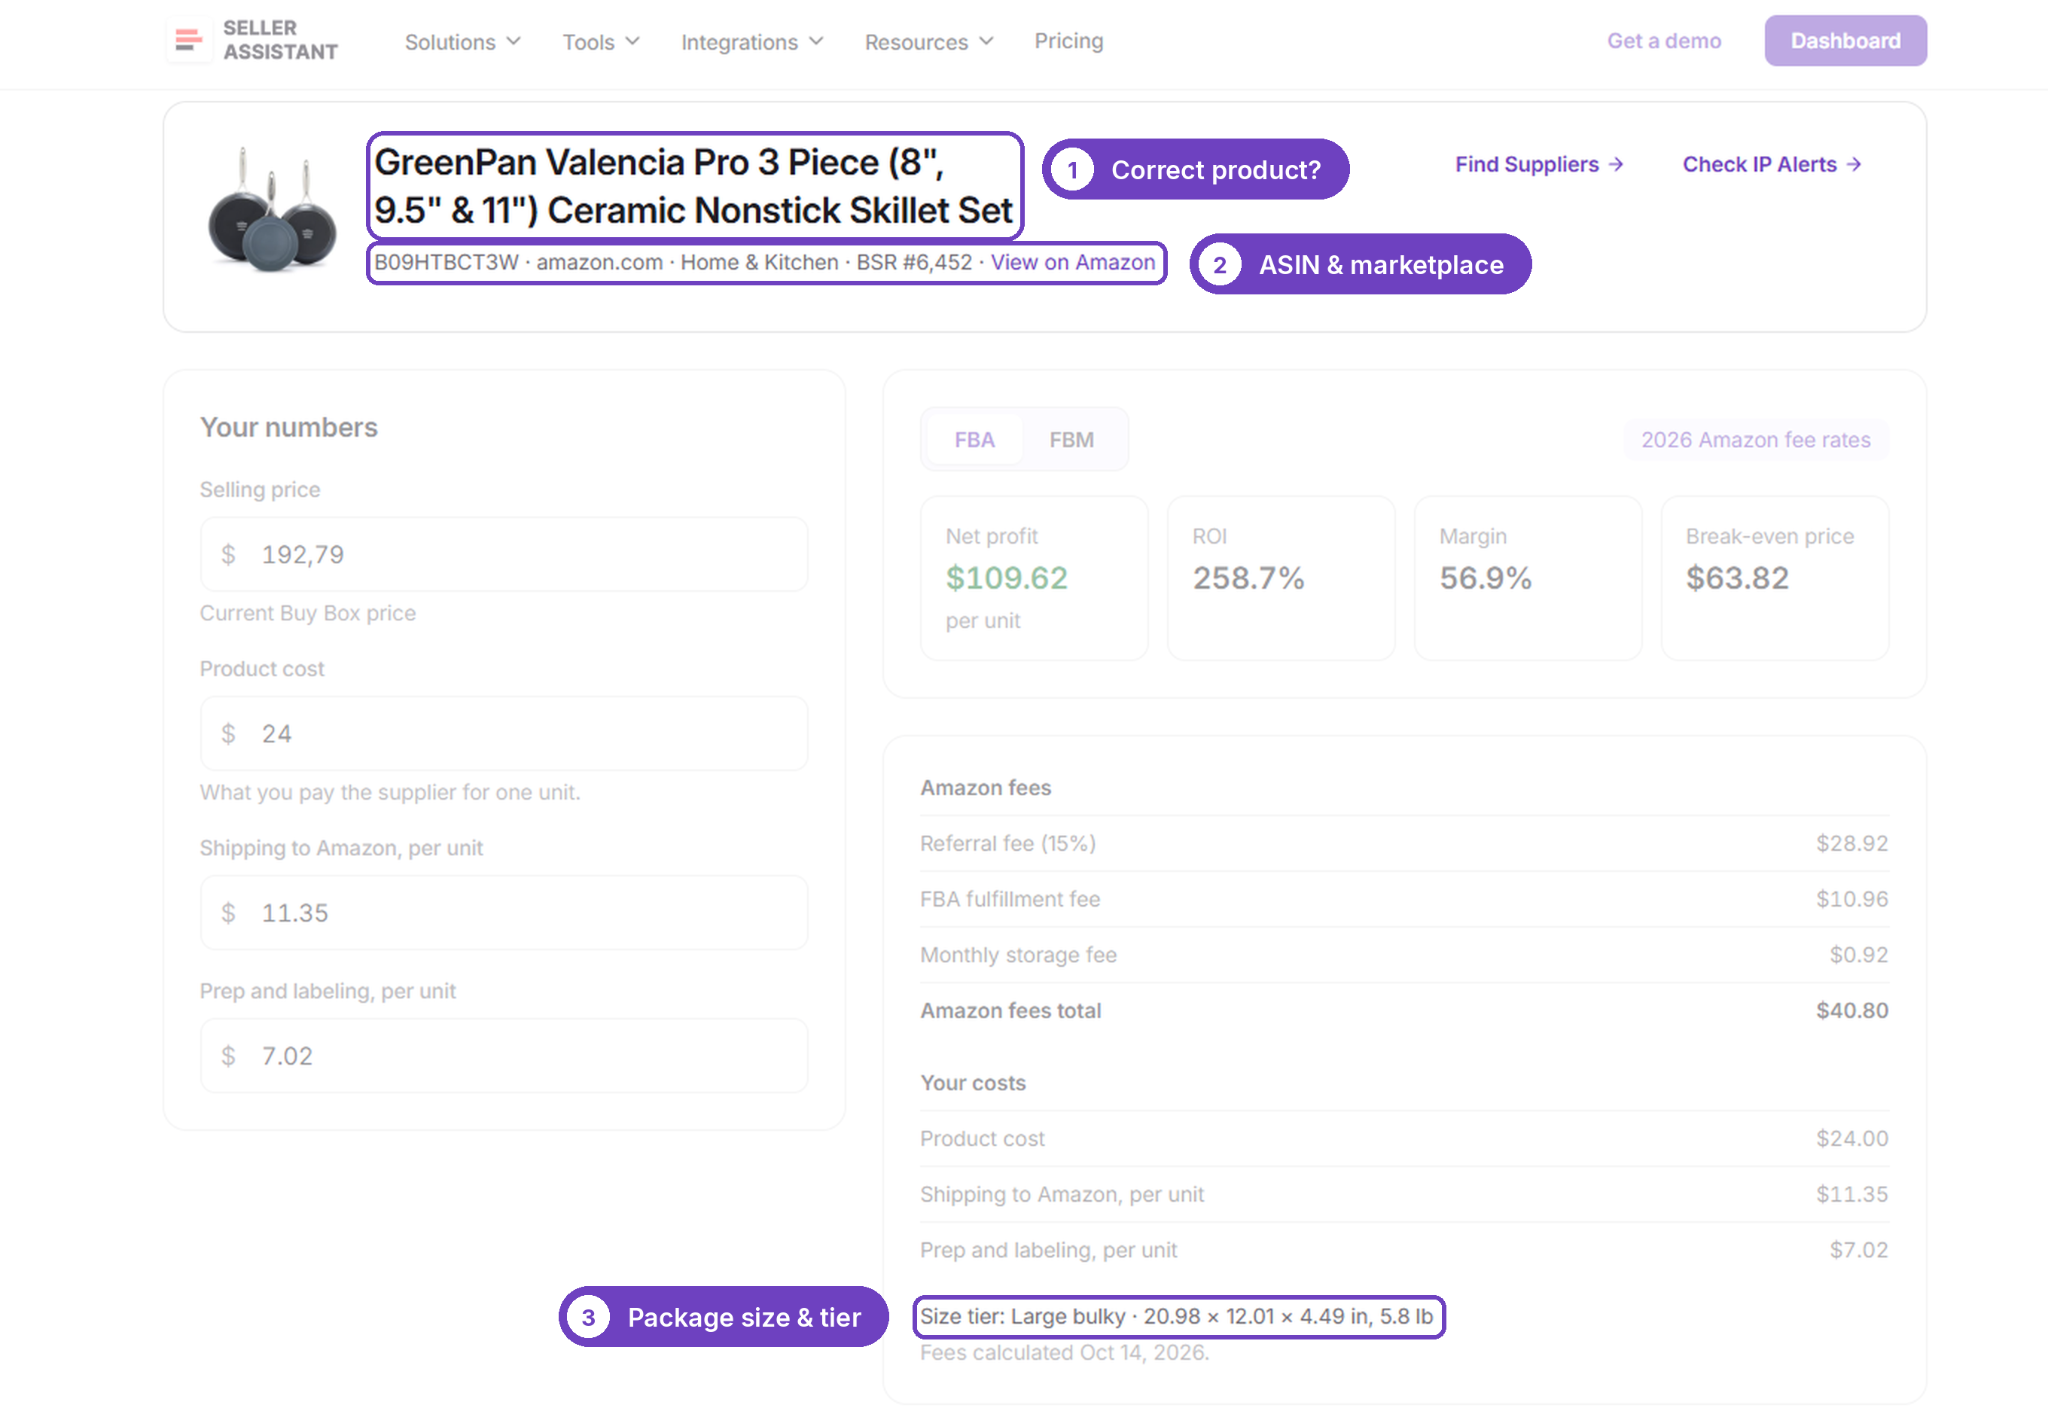
Step 3. Include your product and selling costs
Enter the purchase cost and any additional expenses supported by the tool. Review the applicable Amazon fees and make sure the calculation reflects the costs you expect to pay.
Step 4. Review profitability
Check the estimated profit, ROI, and margin displayed by the calculator. Compare the results with your sourcing requirements and consider whether the product can remain profitable if its selling price changes.
Step 5. Adjust the numbers and compare scenarios
Change the selling price or relevant costs to test different outcomes. If the product only meets your profit target under unusually favorable assumptions, investigate further before purchasing.
FAQ
Do Amazon’s holiday peak fees change these numbers?
Yes. From October 15, 2026 to January 14, 2027, Amazon adds a peak surcharge to the FBA fulfillment fee, so your fee share during the holidays will be higher than the figures in this post, which were measured outside the peak period. Check your products again in mid-January, when the standard rates return.
Does selling FBM avoid the 2026 fee increases?
FBM sellers still pay the referral fee, but not the FBA fulfillment fee, storage fees or the 3.5% fuel surcharge on FBA fulfillment. You pay to ship each order yourself instead, which often makes FBM cheaper for heavy or slow-selling products.
Why do very cheap products lose so much more to Amazon fees?
The referral fee has a minimum of $0.30 per item in the US, and the FBA fee is a fixed amount per unit, so on a low-price item both take a much bigger share of the sale price. On some low-price products, the fees equal or exceed the price itself, which is why the report left those pairs out of its fee comparison.
Do books and video games pay any extra fees?
Yes. Media products, including books, DVDs, music, video games and software, pay a variable closing fee of $1.80 per item in the US on top of the referral fee. Because it’s a fixed amount, it weighs most on low-price media items.
When does Amazon usually announce fee changes?
Amazon typically announces its annual US fee changes in mid-October, with about 90 days’ notice before they take effect on January 15. Other changes, like the April 2026 fuel surcharge, can come mid-year with shorter notice, so recheck your margins whenever Amazon posts a fee update in Seller Central.
Final Thoughts
Amazon seller fees by category took almost the same share of the sale price after both 2026 fee increases. According to Seller Assistant’s State of Amazon Wholesale (Q3 2026), Amazon keeps about 40% of the sale price for the median product, from about 27% to 46% depending on the category. Only Books and Video Games became noticeably more expensive.
For your next pricing and sourcing decisions, that means:
- Use your category’s share, not a flat 40%. The gap between categories is almost 20 points of the sale price.
- Recalculate Books and Video Games products with the current fees.
- Watch supplier costs more closely than Amazon fees. In 2026, they moved margins more.
- Track fees on the same products over time. Monthly fee totals shift with your product mix..
Check the fees on any product in seconds with the free Seller Assistant’s Amazon FBA Calculator, or read the full report for every category and the methodology.