

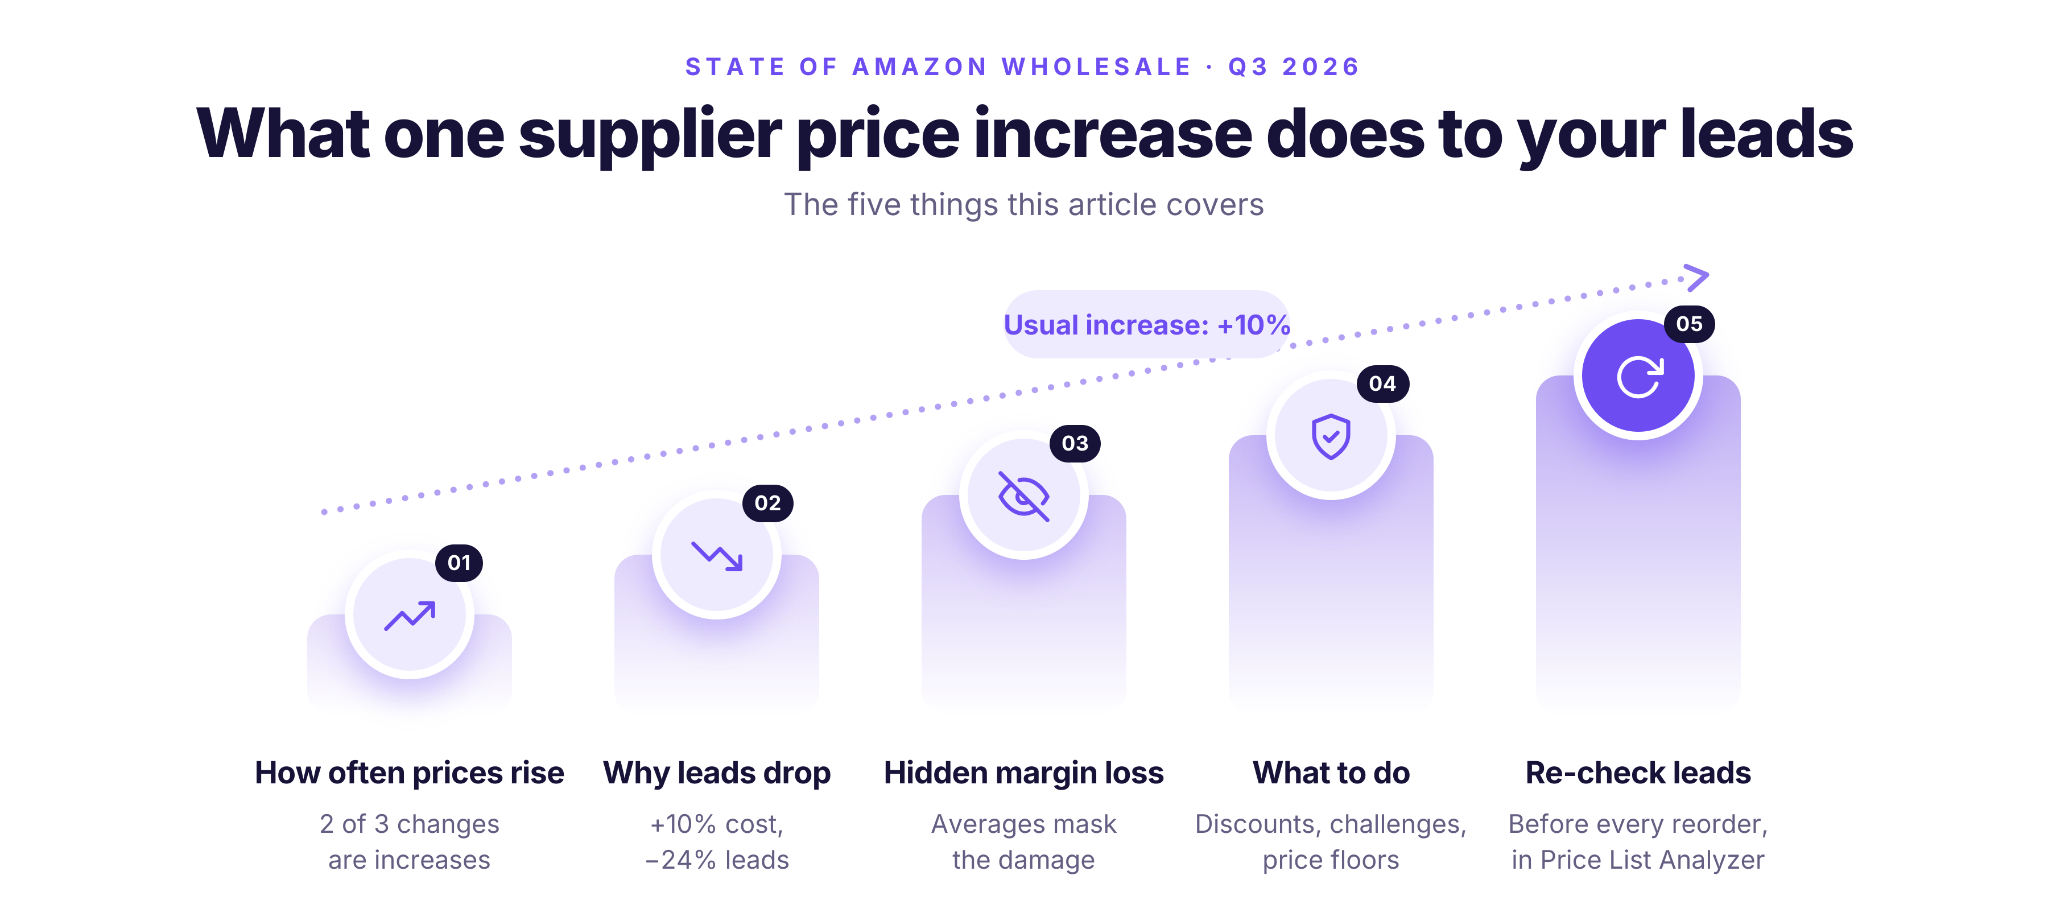
A wholesale supplier price increase is the most common kind of supplier price change. According to Seller Assistant’s State of Amazon Wholesale (Q3 2026), 2 of 3 supplier price changes are increases, usually about +10%.
That one increase removes about 24% of your leads, from 40.8 to 31.2 per 1,000 lines. A 10% wholesale volume discount adds about 29%.
| About This Data | Details |
|---|---|
| Source | Seller Assistant, The State of Amazon Wholesale, Q3 2026. Figures are estimates from anonymized Seller Assistant data and third-party market data. Amazon did not supply or endorse the report. |
| Period and marketplace | July 2025 – August 2026, Amazon.com (US). The report covers 13.5 million supplier lines from 782 verified wholesale sellers. |
| Sample: price changes | 59,577 same-seller, same-product pairs from 15 sellers active in both H2 2025 and 2026. Each pair compares the same seller’s quote for the same product one year apart. |
| Sample: margins | 59,828 same-seller, same-product pairs from 16 sellers. |
How Often Do Wholesale Suppliers Raise Prices?
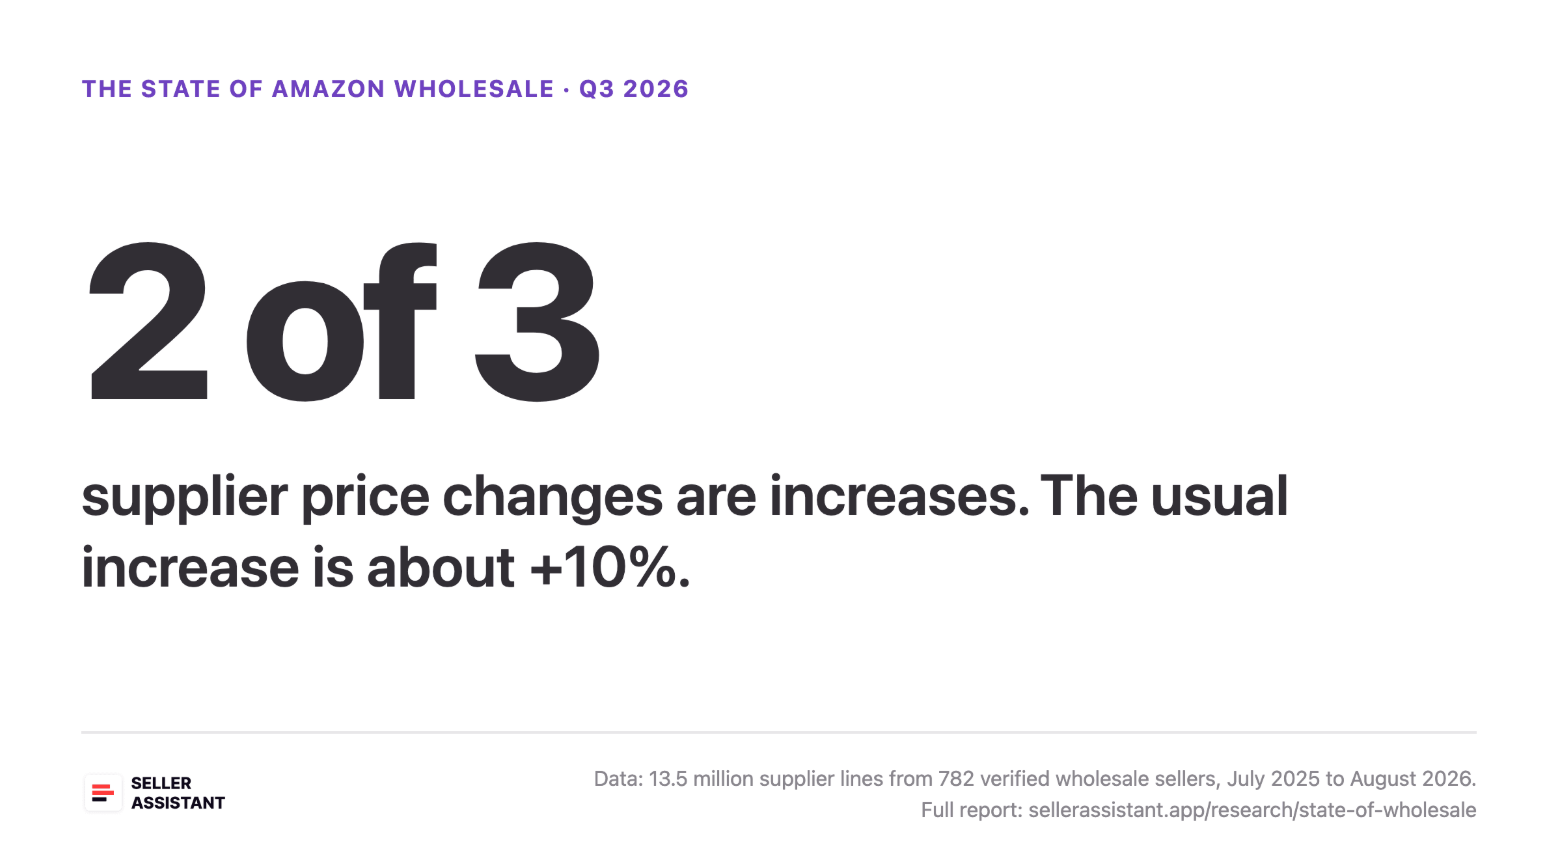
When a supplier changes a price, it’s usually an increase. A wholesale supplier price increase made up 2 of every 3 price changes in the report, and the usual increase was about +10%. According to Seller Assistant’s State of Amazon Wholesale (Q3 2026), 65.5% of supplier price changes are increases, with a median increase of +10.4%.
Most quotes don’t change at all
Four in ten supplier quotes stayed the same to the cent from one year to the next. The real share is probably lower: some “unchanged” quotes are old price lists uploaded again, not suppliers holding their prices.
When prices move, they usually go up
Of all quotes, 26.9% rose by more than 2% and 14.2% fell by more than 2%, so increases outnumber decreases by about two to one. The pattern holds without the largest seller in the sample: 72% of the remaining changes were still increases.
The usual increase is about +10%
The median supplier increase was +10.4%, and the median cut was –10%. Across all quotes, including the unchanged ones, supplier costs rose by about +1.7% on average. That average stays small because a few big changes are spread across many lines that didn’t move, which makes increases easy to miss.
Some categories rose much faster
In Home & Kitchen, Kitchen & Dining, and Clothing, Shoes & Jewelry, more than half of the quotes rose by more than 2%. The median increase in those categories was +23% to +35%. The sample per category is small, so read these directions rather than exact figures. Still, if you source in these categories, expect higher prices on your next quote.
Why Does a 10% Price Increase Cut 24% of Your Leads?
An Amazon supplier price increase of 10% doesn’t cut 10% of your leads. It cuts about 24%, because most leads sit just above the 20% ROI line, and a small cost change pushes them under it. According to Seller Assistant’s State of Amazon Wholesale (Q3 2026), a usual +10% supplier price increase reduces leads from 40.8 to 31.2 per 1,000 supplier lines.
How a small cost change breaks a lead
Take a product with a $20 Buy Box price, about $7.80 in referral and FBA fees, and a $10 supplier cost:
- Today: $2.20 profit, 22% ROI. It’s a lead.
- After a +10% increase ($11): $1.20 profit, 11% ROI. It’s no longer a lead.
- After a 10% discount ($9): $3.20 profit, 36% ROI. It’s a solid lead.
The supplier cost moved by $1, but ROI halved, because profit is what’s left after Amazon takes about 40% of the sale price. Every real lead has to clear that 20% line, and many clear it by only a few points.
What the full data shows
| Supplier Cost | Leads per 1,000 Supplier Lines | vs. Today | Profitable Lines per 1,000 |
|---|---|---|---|
| 10% volume discount | 52.7 | +29% | 180 |
| 5% volume discount | 46.5 | +14% | 167 |
| Today | 40.8 | – | 153 |
| 5% increase | 35.6 | –13% | 140 |
| Usual increase (+10%) | 31.2 | –24% | 127 |
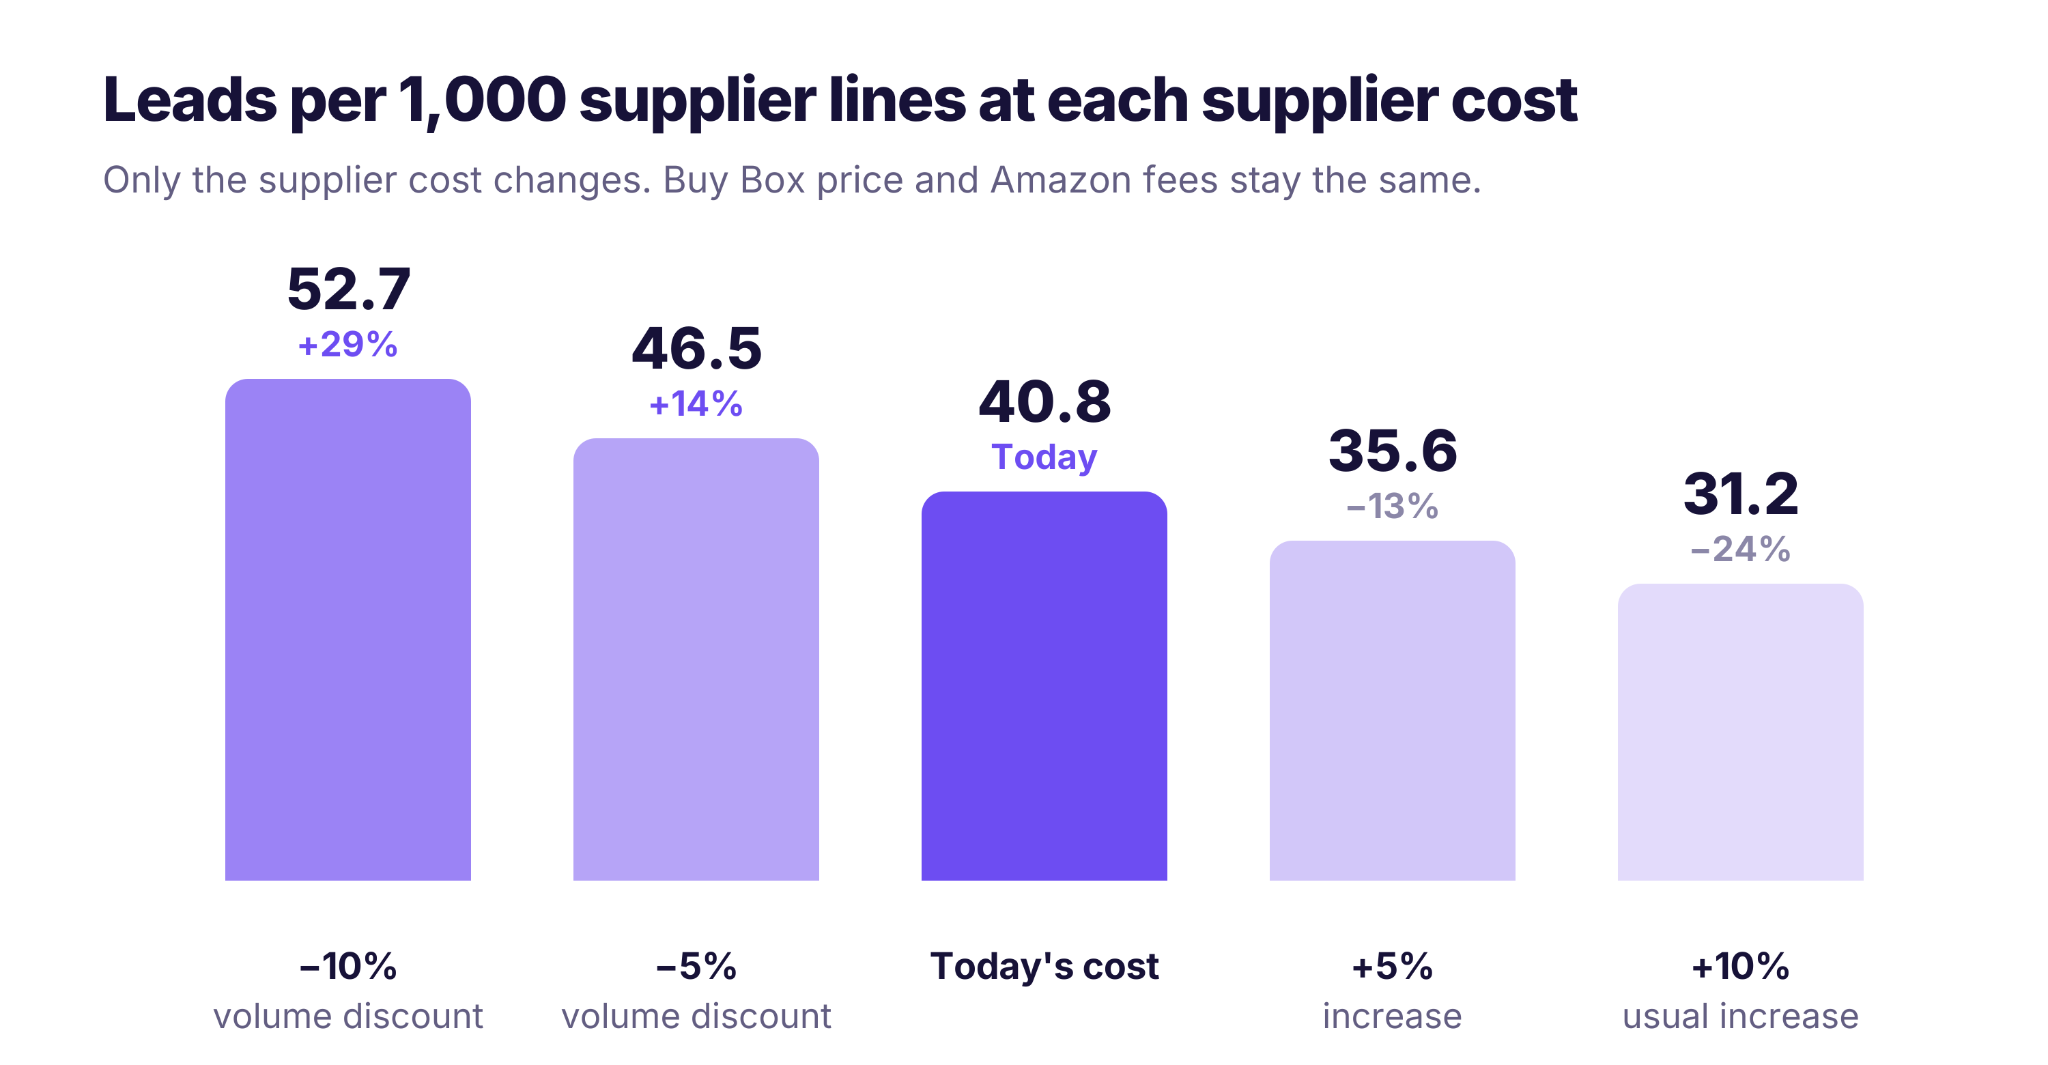
The effect isn’t symmetrical. A 10% wholesale volume discount adds about 29% more leads, more than the 24% an increase removes. A lower cost raises profit and shrinks the cost that ROI is measured against, so lines that sat just below 20% move above it.
Which categories feel it most
Per 1,000 matched lines, a +10% increase hits Electronics and Musical Instruments hardest, cutting leads by 38% in each. Video Games loses 34% and Health & Household 32%. Arts, Crafts & Sewing is the most resilient, at –16%.
The same categories gain the most from a discount: Video Games +66%, Electronics +47%, and Musical Instruments +44%. If you source in these categories, each cent of supplier cost matters more than average.
Why Don’t Your Margins Show the Damage?
The average hides it. Margins on repeat products barely moved this year, yet nearly half of products lost more than a point. According to Seller Assistant’s State of Amazon Wholesale (Q3 2026), the median margin on repeat products changed by only –0.08 points, but 45% of products lost more than a point of margin.
Gains and losses cancel out
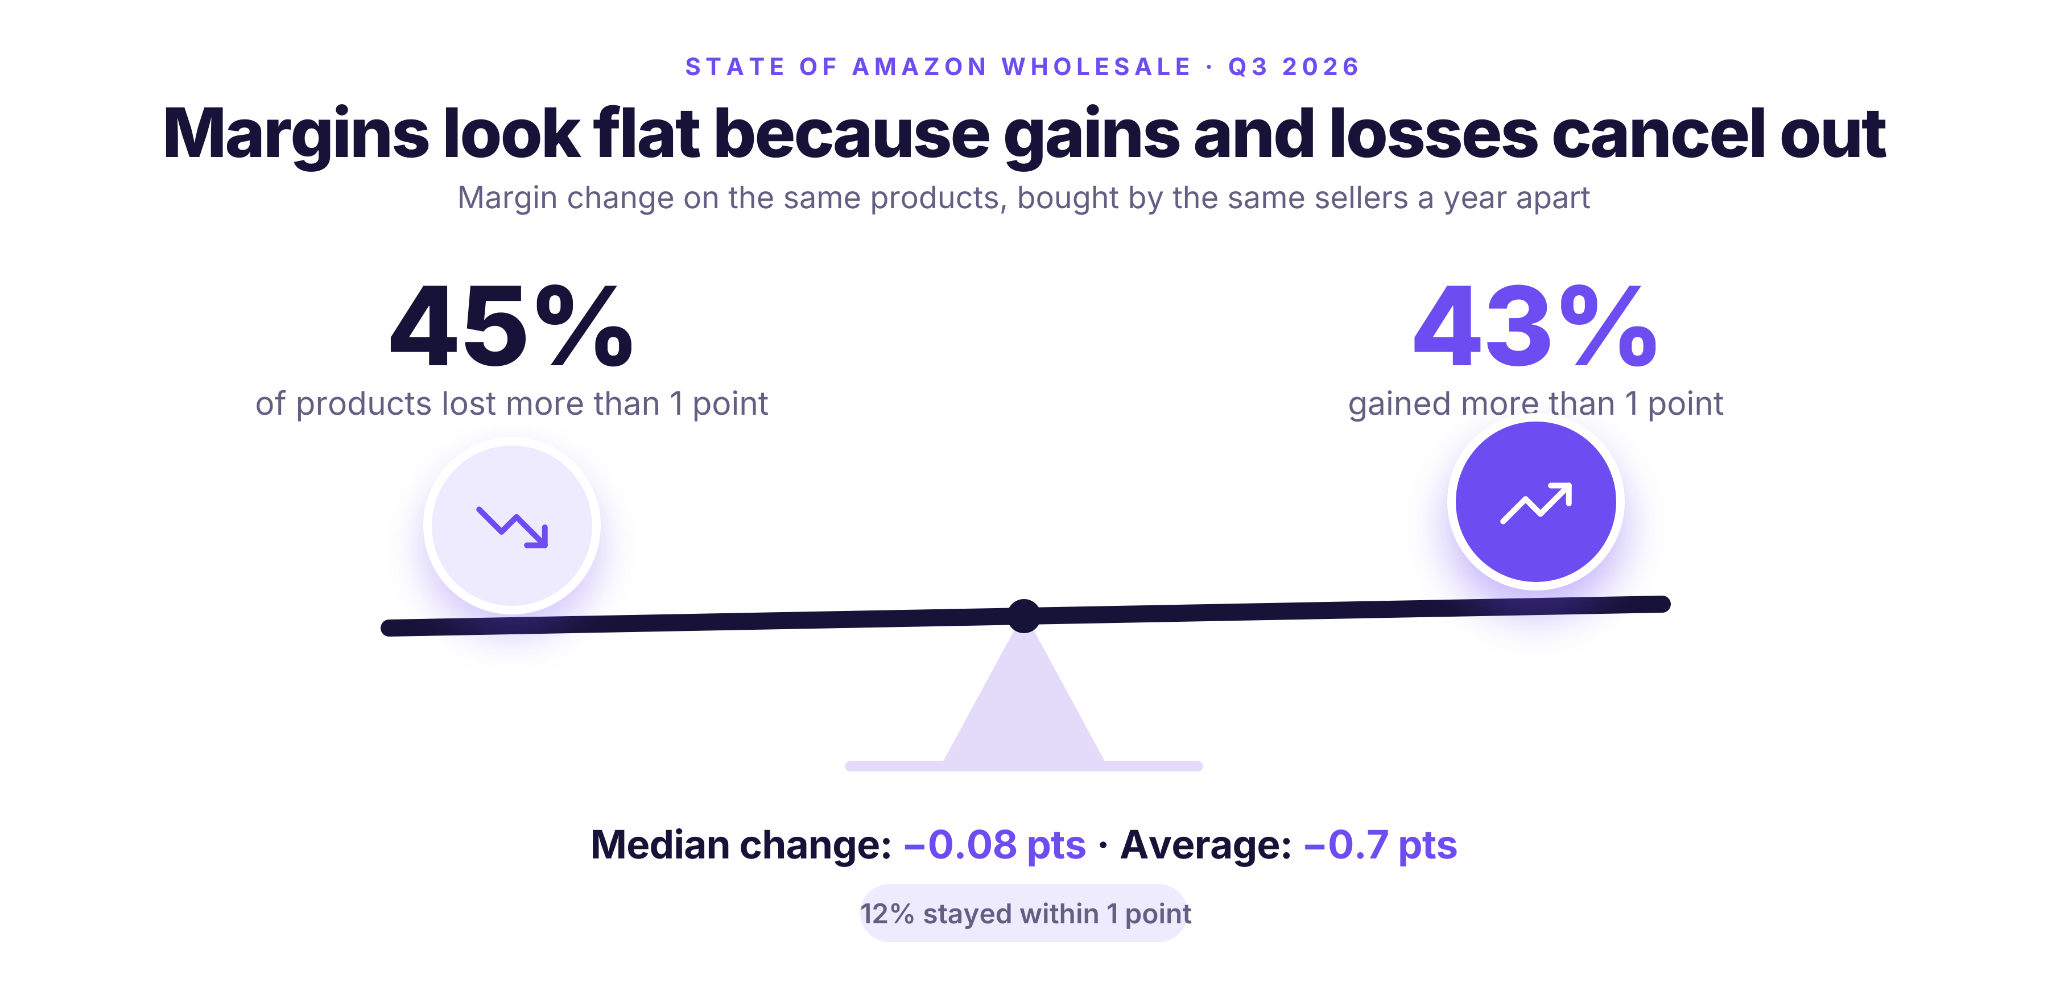
For the same products bought by the same sellers a year apart, 45% lost more than a point of margin and 43% gained more than a point. Only about 12% stayed within a point. Add them up and the result looks flat: –0.08 points for the median product and –0.7 points on average.
The median is held down by the 4 in 10 quotes that didn’t change at all. A margin report that averages across your whole catalog will show almost no movement, even while the products that got more expensive slip under your ROI floor.
Where costs rose, sellers paid for it
In the categories where even the median supplier cost went up, Amazon selling prices didn’t follow, so sellers absorbed the increase.
| Category | Median Supplier Cost | Median Selling Price | Margin Change |
|---|---|---|---|
| Home & Kitchen | +5.2% | 0.0% | –6.1 pts |
| Clothing, Shoes & Jewelry | +8.1% | +0.2% | –5.9 pts |
| Musical Instruments | +5.5% | +2.5% | –3.5 pts |
| Kitchen & Dining | +5.1% | 0.0% | –1.1 pts |
The sample per category is small, so read these as a direction rather than exact values. In all four categories, Buy Box prices stayed flat or rose far less than supplier costs.
Why lead counts react faster than margins
A margin average treats a product that drops from 30% to 27% ROI the same as one that drops from 22% to 18%. Only the second one stops being a lead. That’s why one +10% increase can leave your average margin looking fine while a quarter of your leads disappear. Check leads line by line, not margins in aggregate.
What Should You Do When a Supplier Raises Prices?
Treat every supplier price increase on Amazon as a reason to re-check your leads, not just your invoice. These four steps keep one increase from quietly removing a quarter of your buy list.
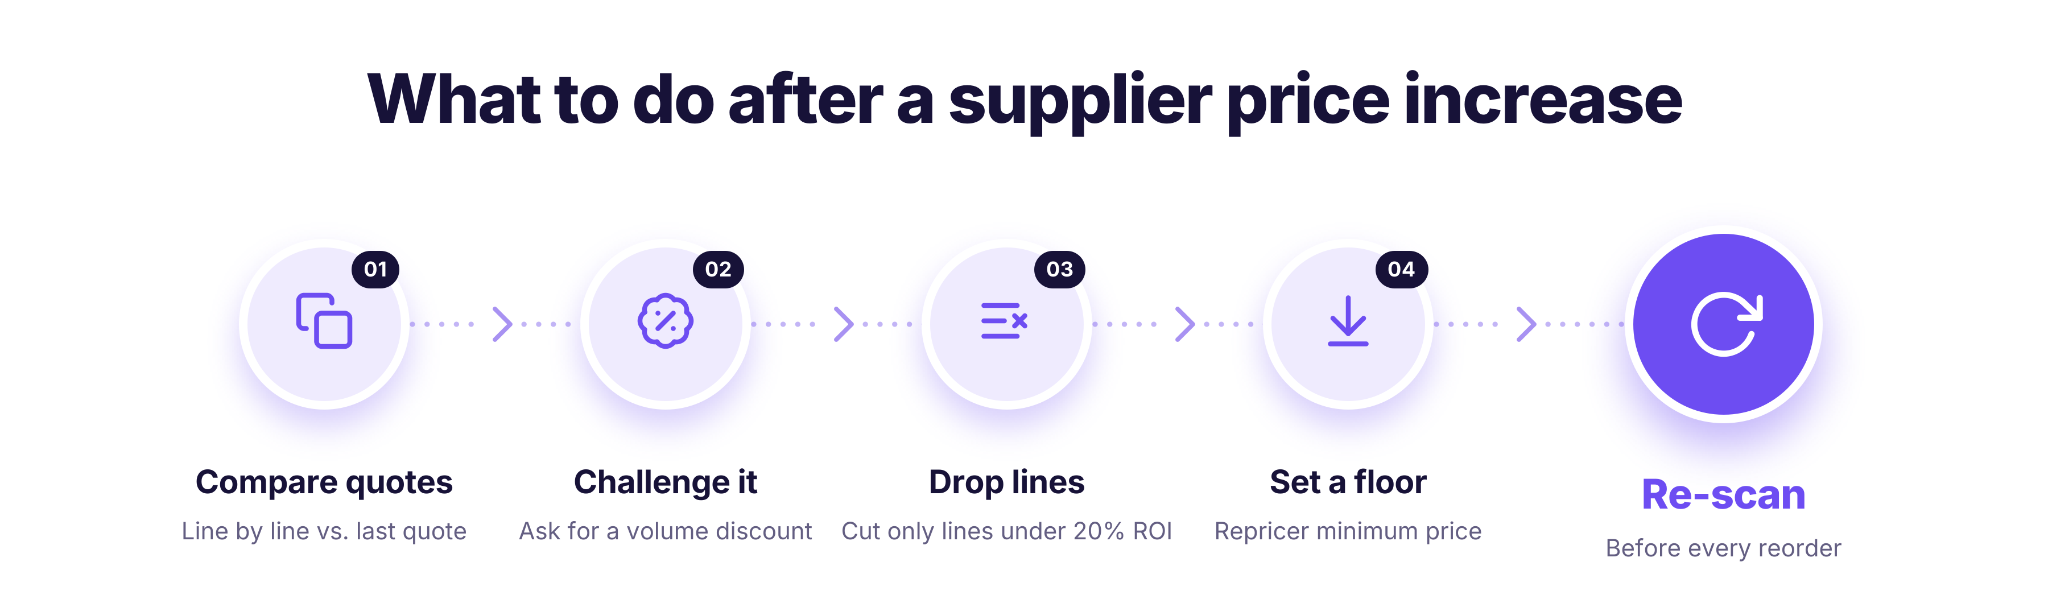
Compare each line with the last quote
Don’t trust a supplier’s summary like “prices up 3%.” Check line by line. Averages hide the increases that matter, and an unchanged quote may be an old price list sent again, so confirm the prices are current.
Challenge each increase
Ask what changed and whether the price is final. A 10% wholesale volume discount gives you about 29% more leads, so the lines you reorder most are the ones worth pushing on. For tactics, see our full supplier pricing playbook.
Drop lines, not suppliers
If the increase stands, cut only the products that fell below your ROI floor. The rest of the supplier’s list may still hold most of your leads.
Set a minimum price in your repricer
A price floor based on your new cost stops your repricer from selling below your margin between reorders. Here’s how to set a profitable Amazon repricing floor.
Each of these steps starts with knowing which leads survived the new price. That’s a re-scan, not a spreadsheet exercise.
How Do You Re-Check Your Leads Before a Reorder?
A new quote means new ROI on every line, so last month’s buy list can’t be trusted until you scan it again.
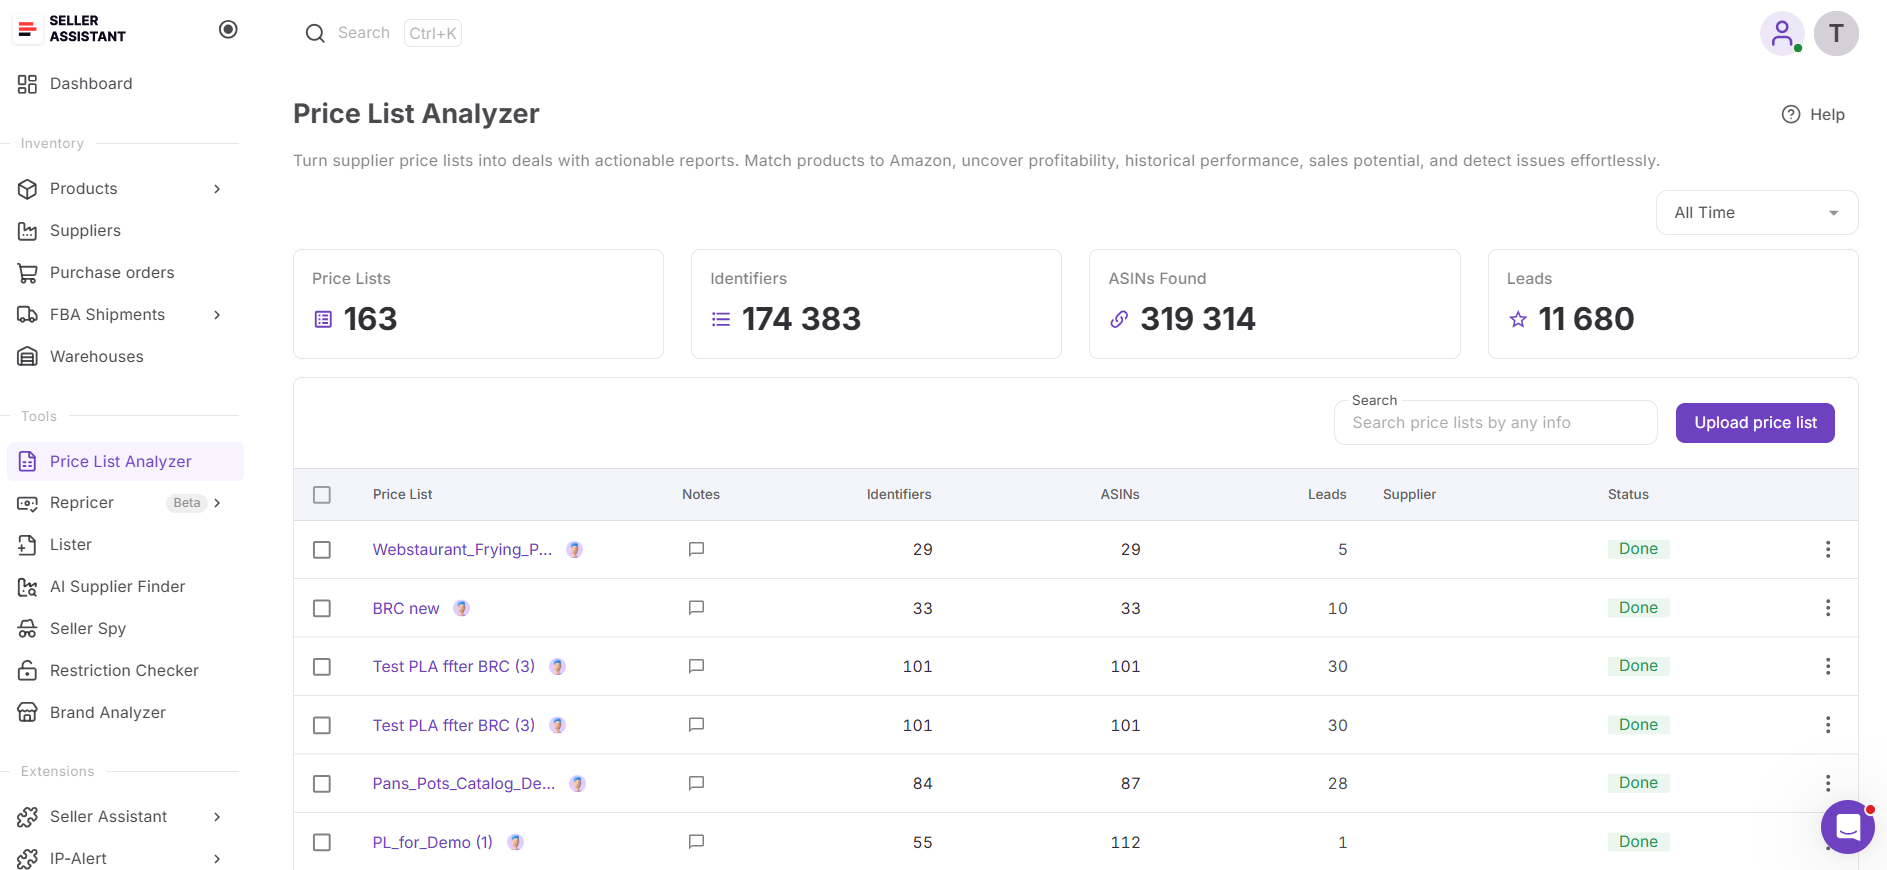
Price List Analyzer is Seller Assistant’s bulk sourcing tool for that check. It matches each line of a supplier price list to Amazon listings, calculates fees, profit and ROI at the new cost, and adds sales, Buy Box and risk data, so you can see which leads survived a price increase before you place the order.
What Price List Analyzer does for you
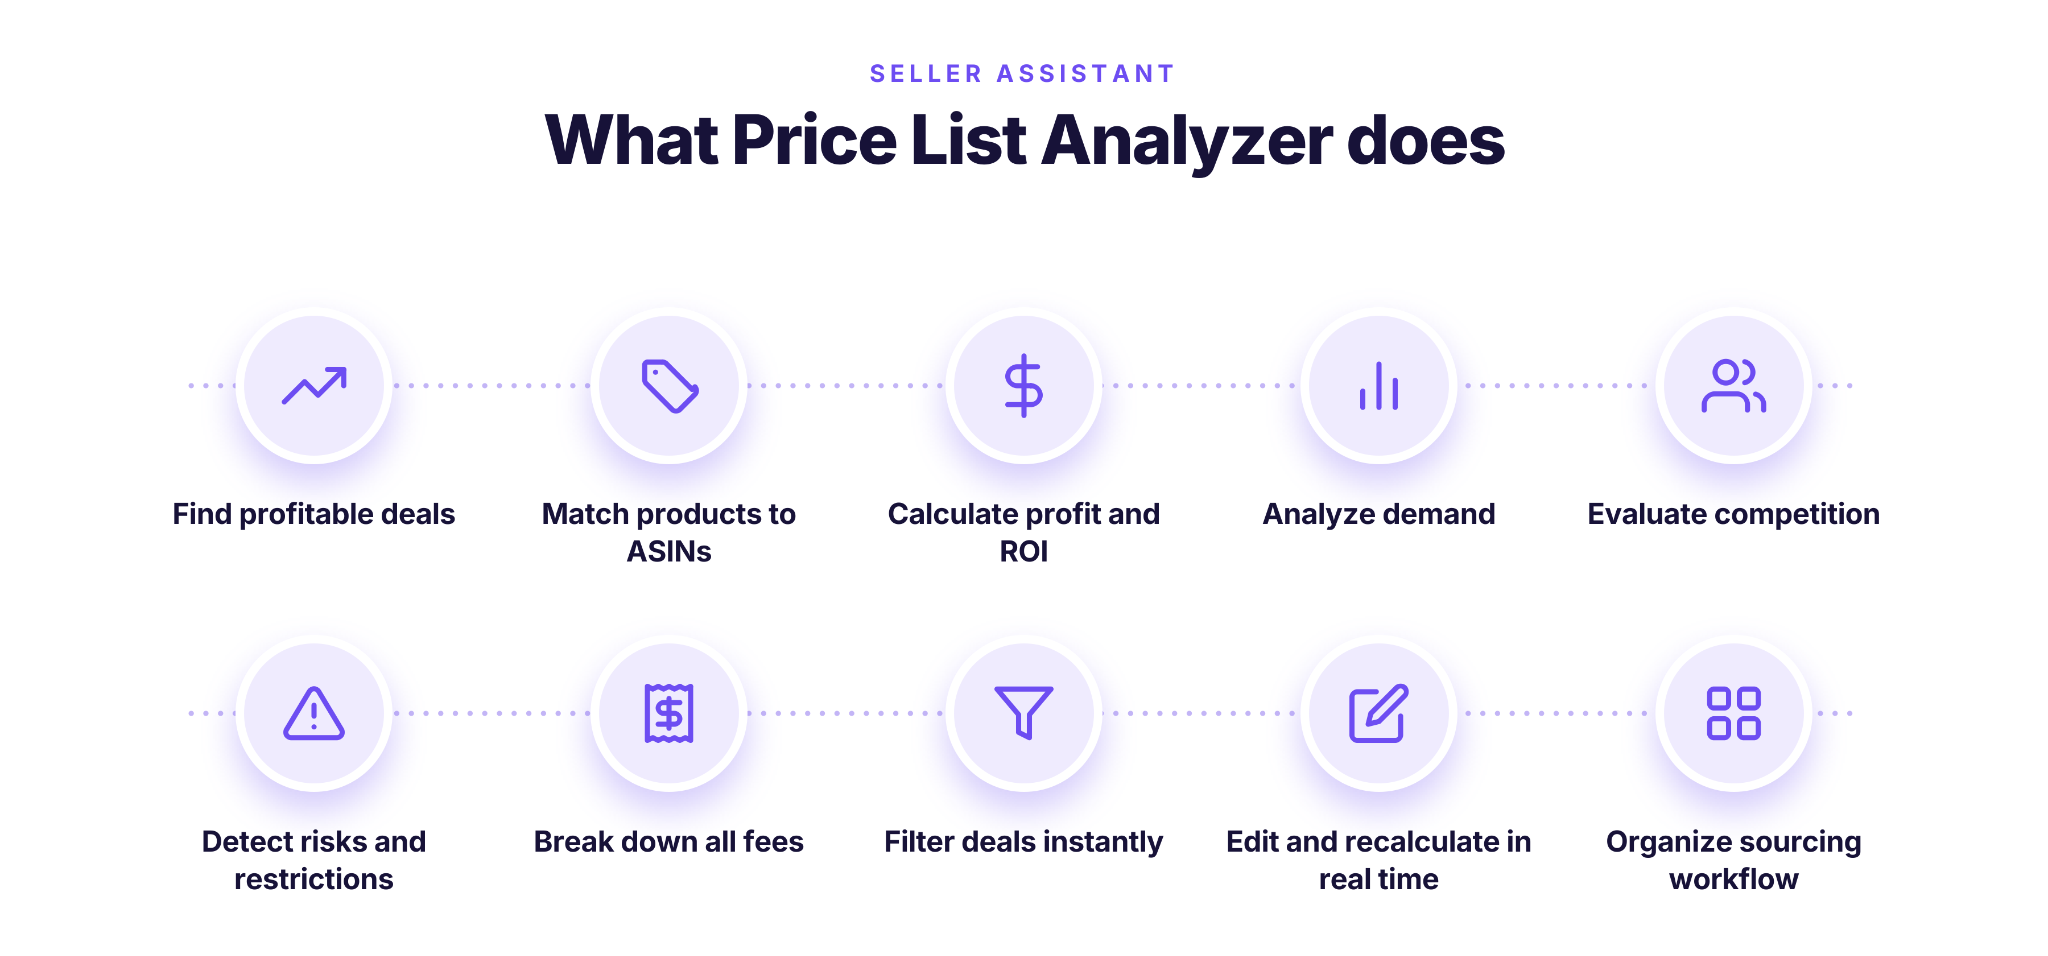
- Process supplier catalogs in bulk
Evaluate hundreds or thousands of products in one run without checking every Amazon listing individually.
- Identify corresponding Amazon listings
Match supplier product identifiers with Amazon ASINs to reduce manual searches and prepare products for further analysis.
- Measure FBA and FBM returns
See estimated profit, ROI, margin, break-even price, maximum COG, seller proceeds, and cost breakdowns that account for Amazon fees and sourcing expenses.
- Check how well products sell
Examine estimated monthly sales, current and historical BSR, and Sales Rank Drops to assess demand over time.
- Review Buy Box pricing patterns
Compare today’s Buy Box price with historical averages and price movements to determine whether projected returns depend on unusually high selling prices.
- See who competes on each listing
Examine offer counts, Buy Box-eligible FBA and FBM sellers, leading competitors, Buy Box share, and Amazon’s participation on each listing.
- Identify potential sourcing problems
Flag IP-related concerns, selling restrictions, HazMat, meltable, fragile, and oversized products, missing Buy Box data, and other issues that need further review.
- Create targeted product shortlists
Apply filters for profitability, sales, competition, prices, categories, brands, restrictions, and risks, then save useful filter combinations for future catalogs.
- Compare different cost assumptions
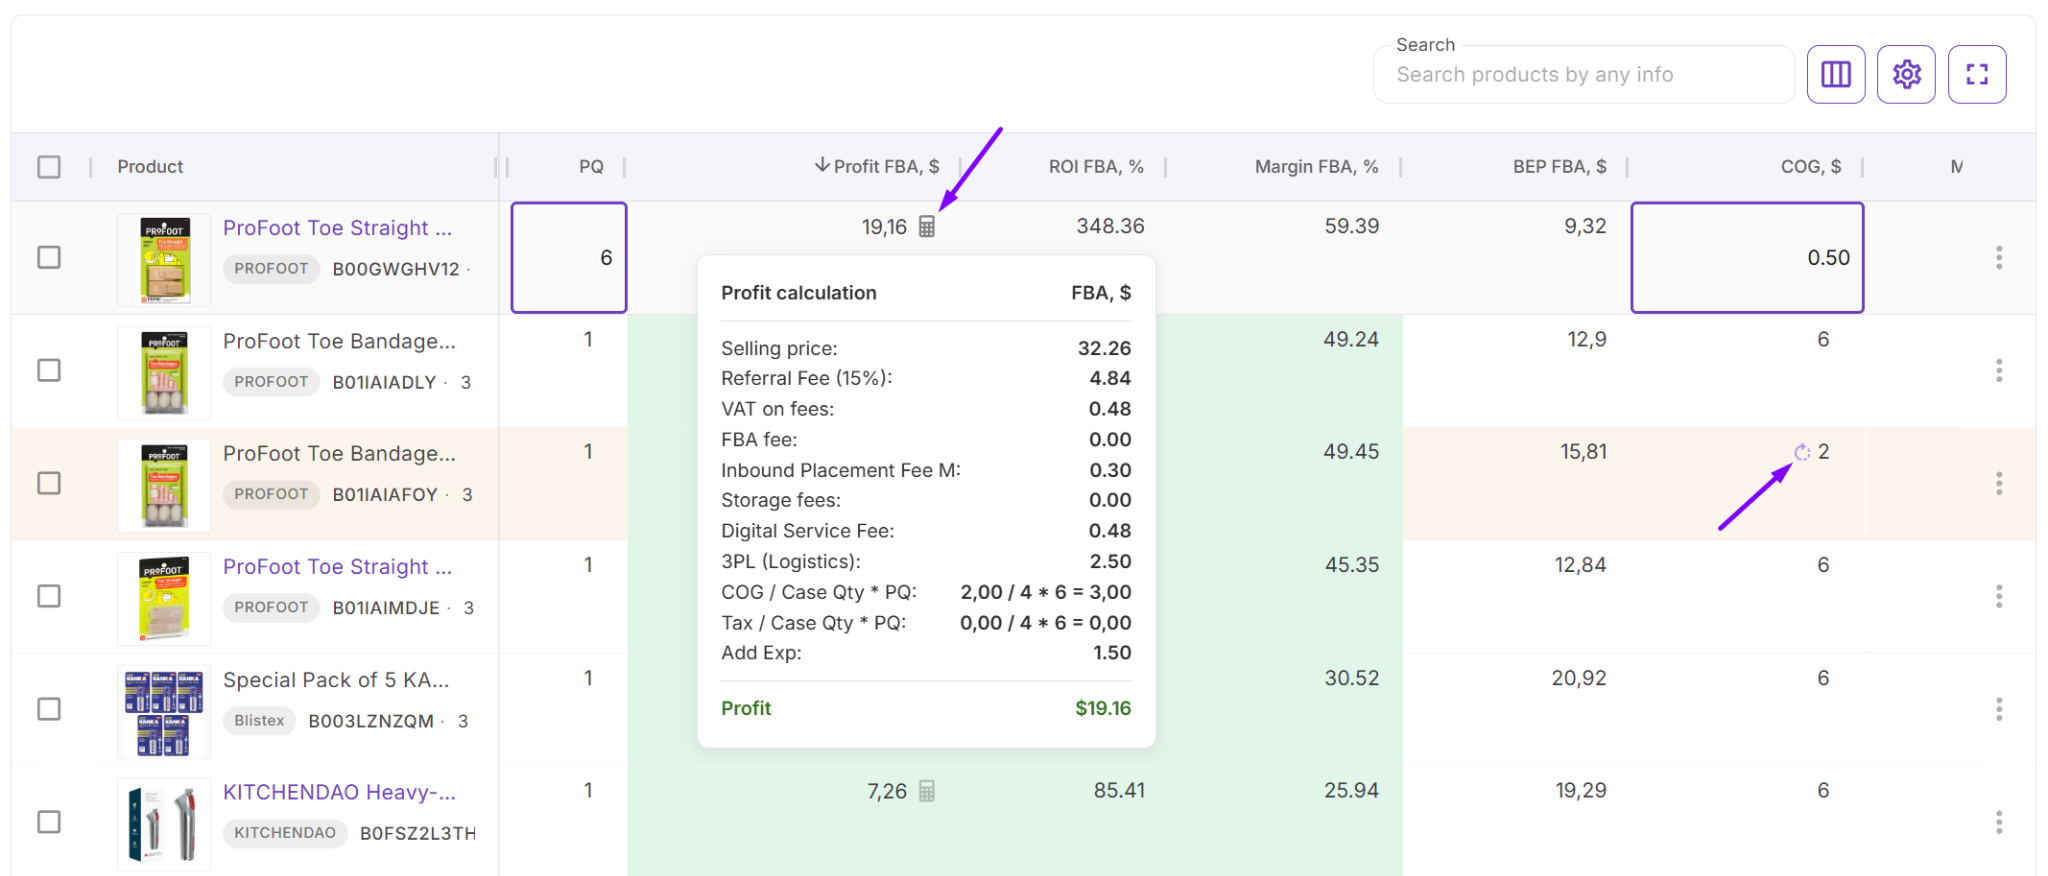
Update product costs, shipping, preparation fees, taxes, package quantities, and other expenses to recalculate returns without importing the supplier file again.
- Manage promising products
Use likes, dislikes, tags, notes, and saved views to record decisions, prioritize leads, and share research context with your team.
- Download the results you need
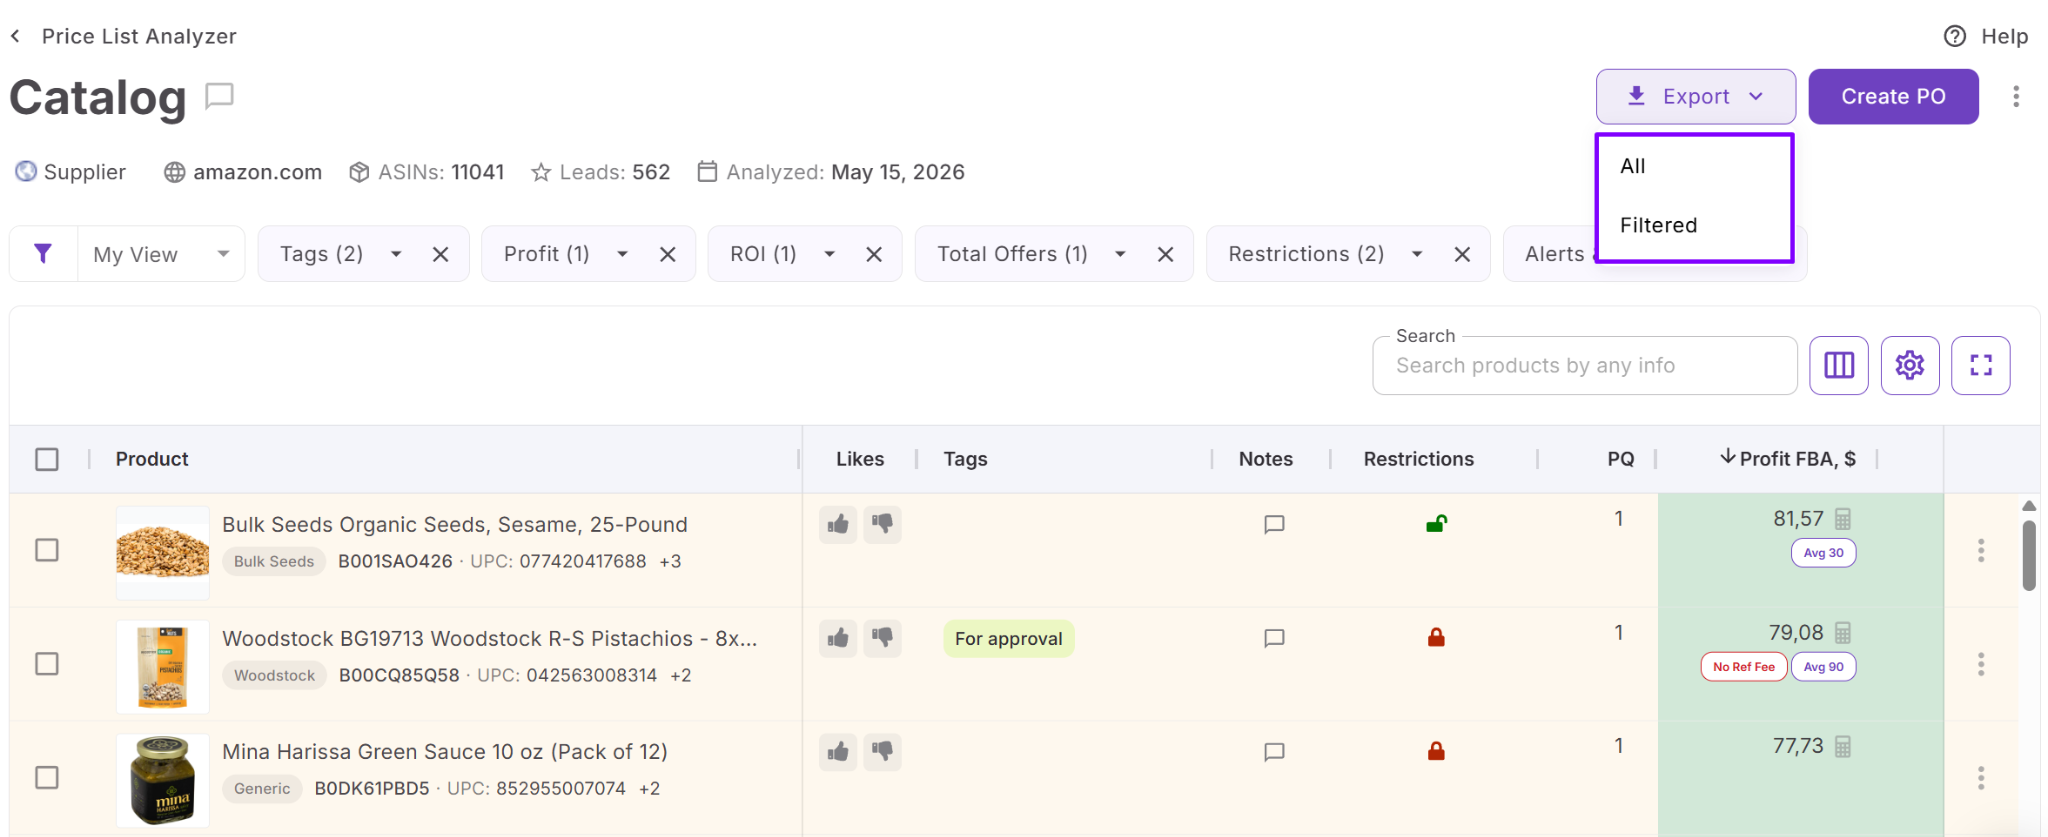
Export the complete catalog analysis, a filtered shortlist, or individual product selections for the next sourcing stage.
- Create purchase orders from selected items
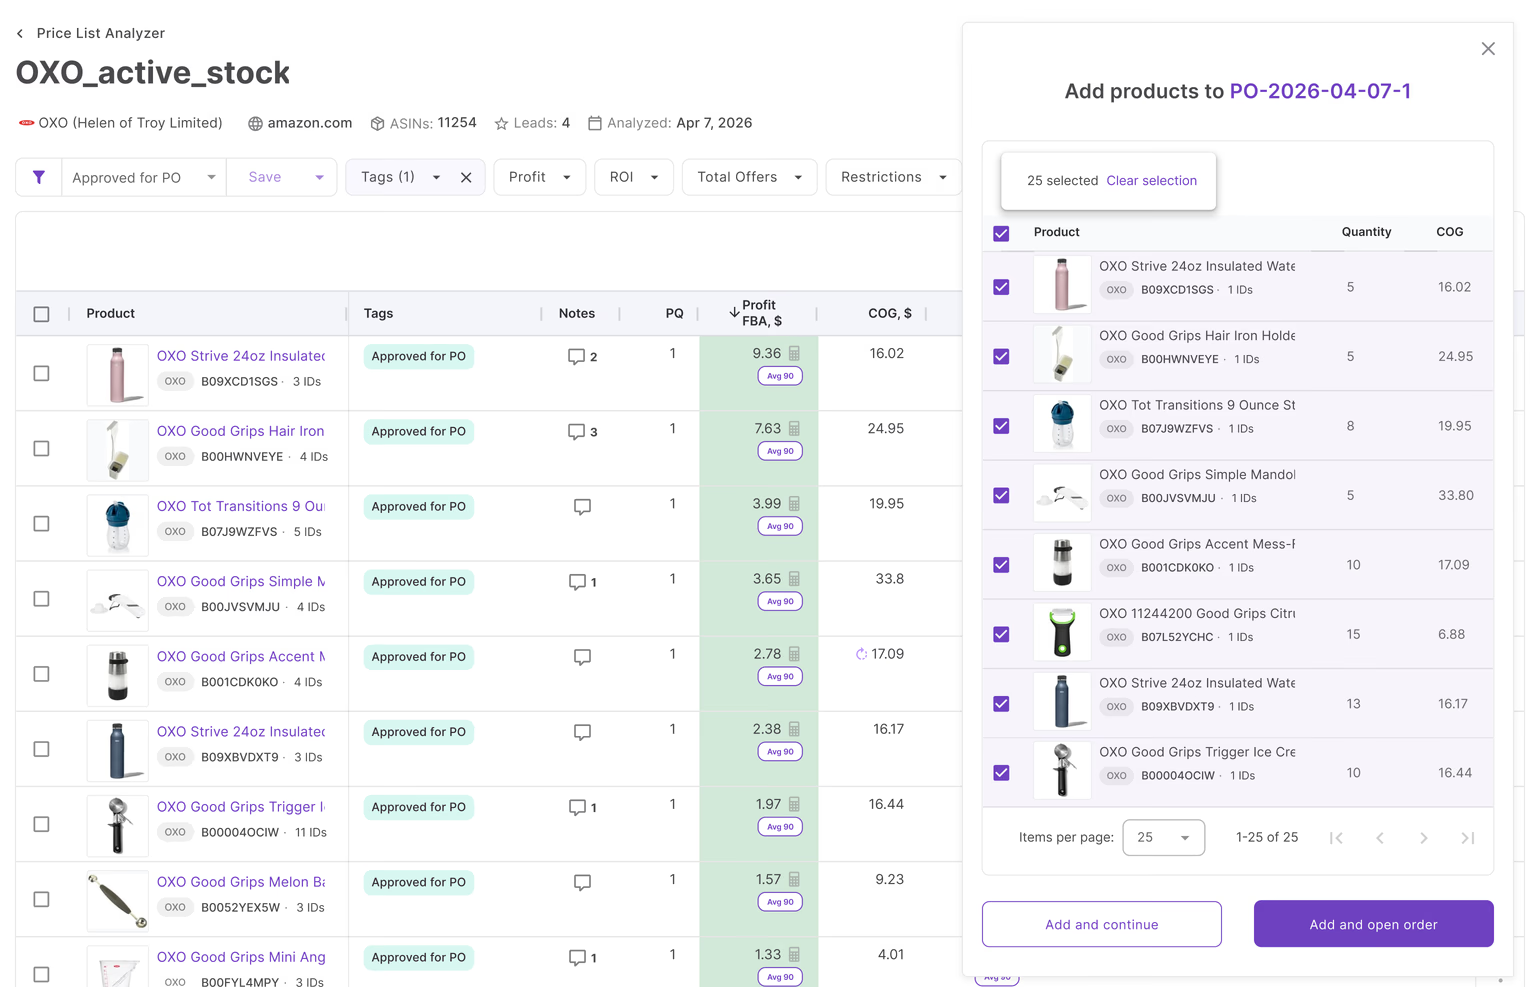
Send shortlisted products to Seller Assistant’s purchase order workflow using Add to PO, without manually recreating the product records.
How to use Price List Analyzer in steps
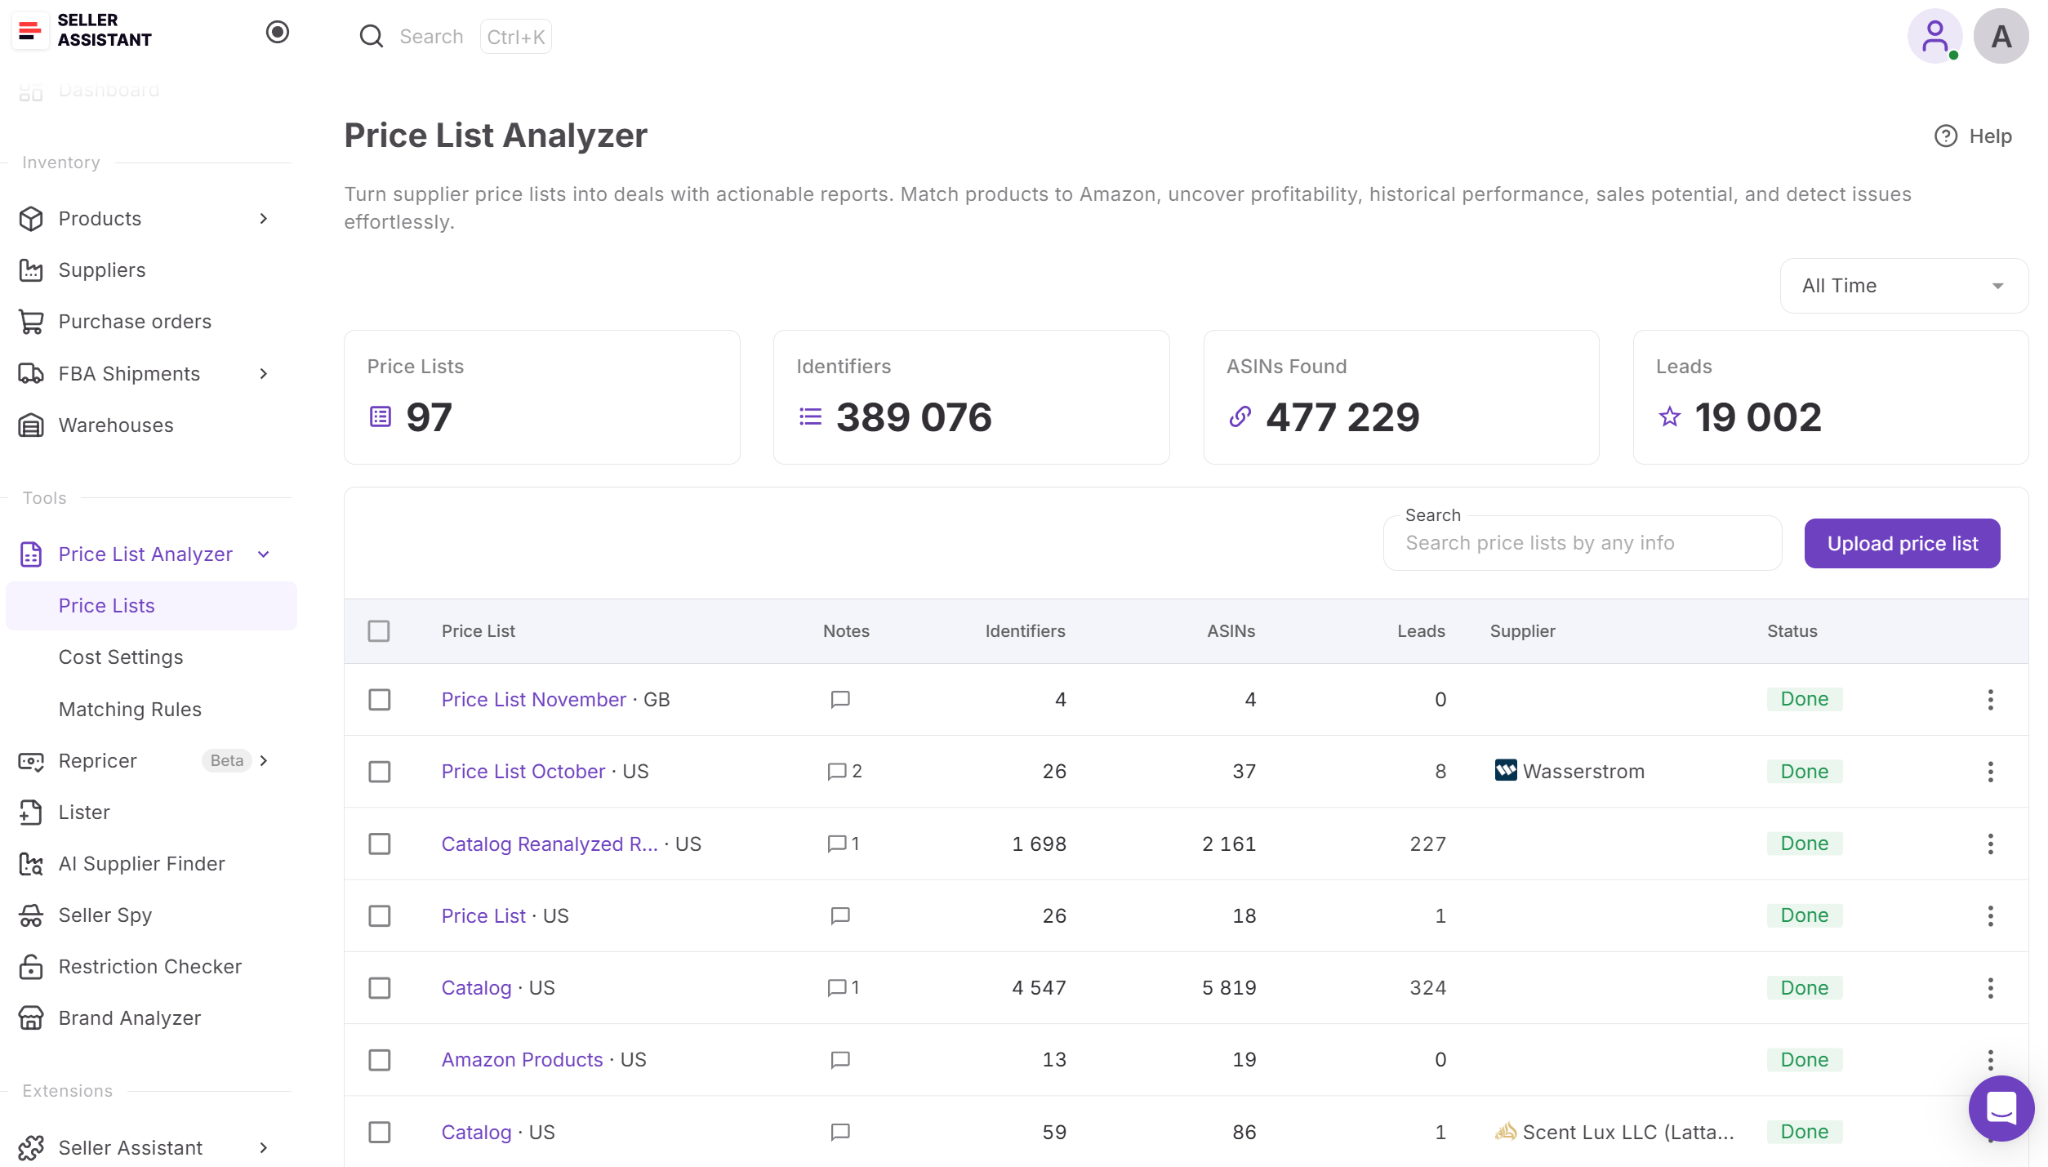
Step 1. Import your supplier catalog
Sign in to Seller Assistant and open Tools → Price List Analyzer. Click Upload price list, choose the Amazon marketplace you sell on, and select your supplier’s .xlsx or .xls spreadsheet.
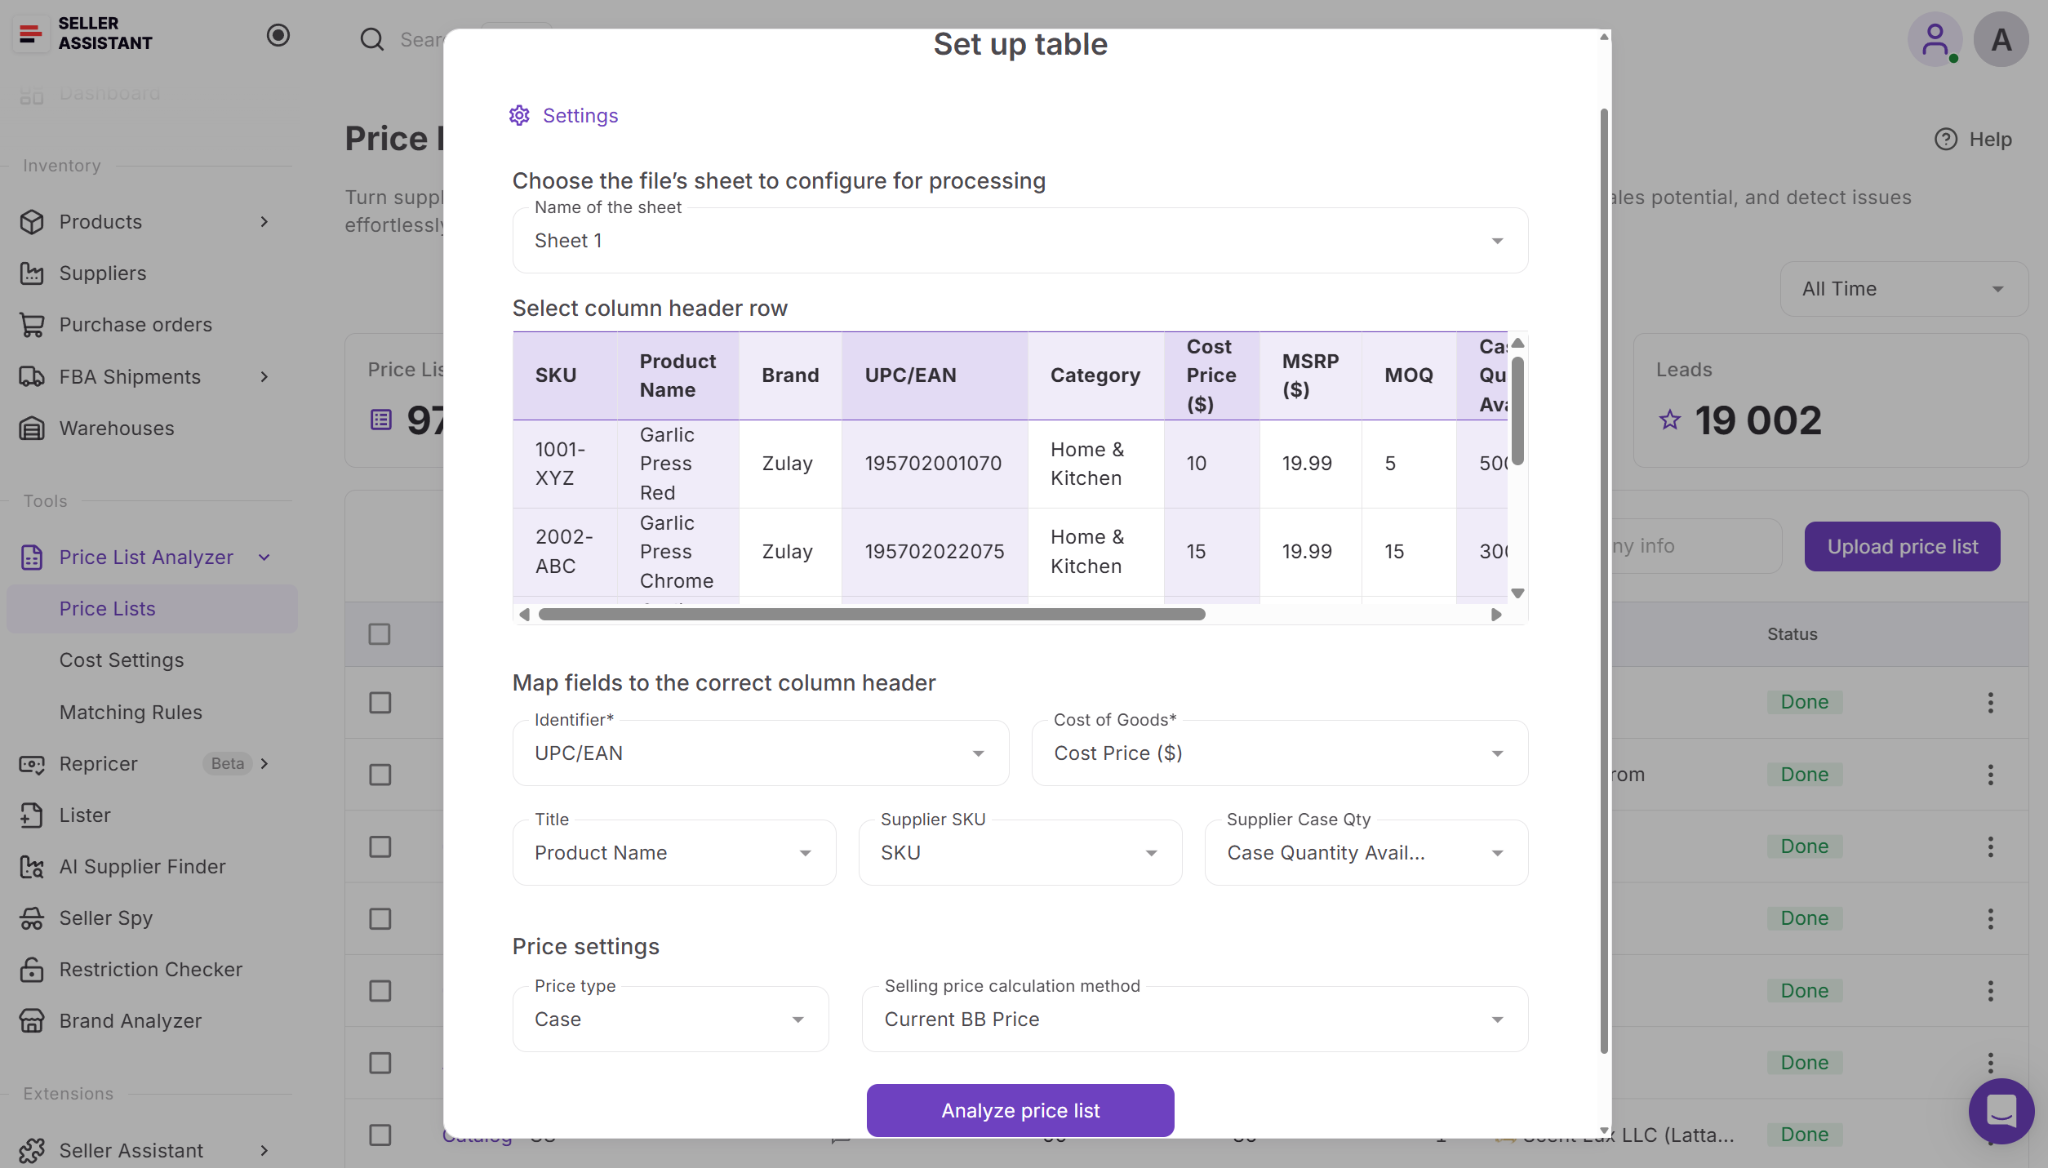
Step 2. Set up the file for analysis
Assign the spreadsheet columns to the corresponding product identifiers and cost fields, including COG. Adjust the analysis settings for your catalog and select Analyze Price List to begin processing.
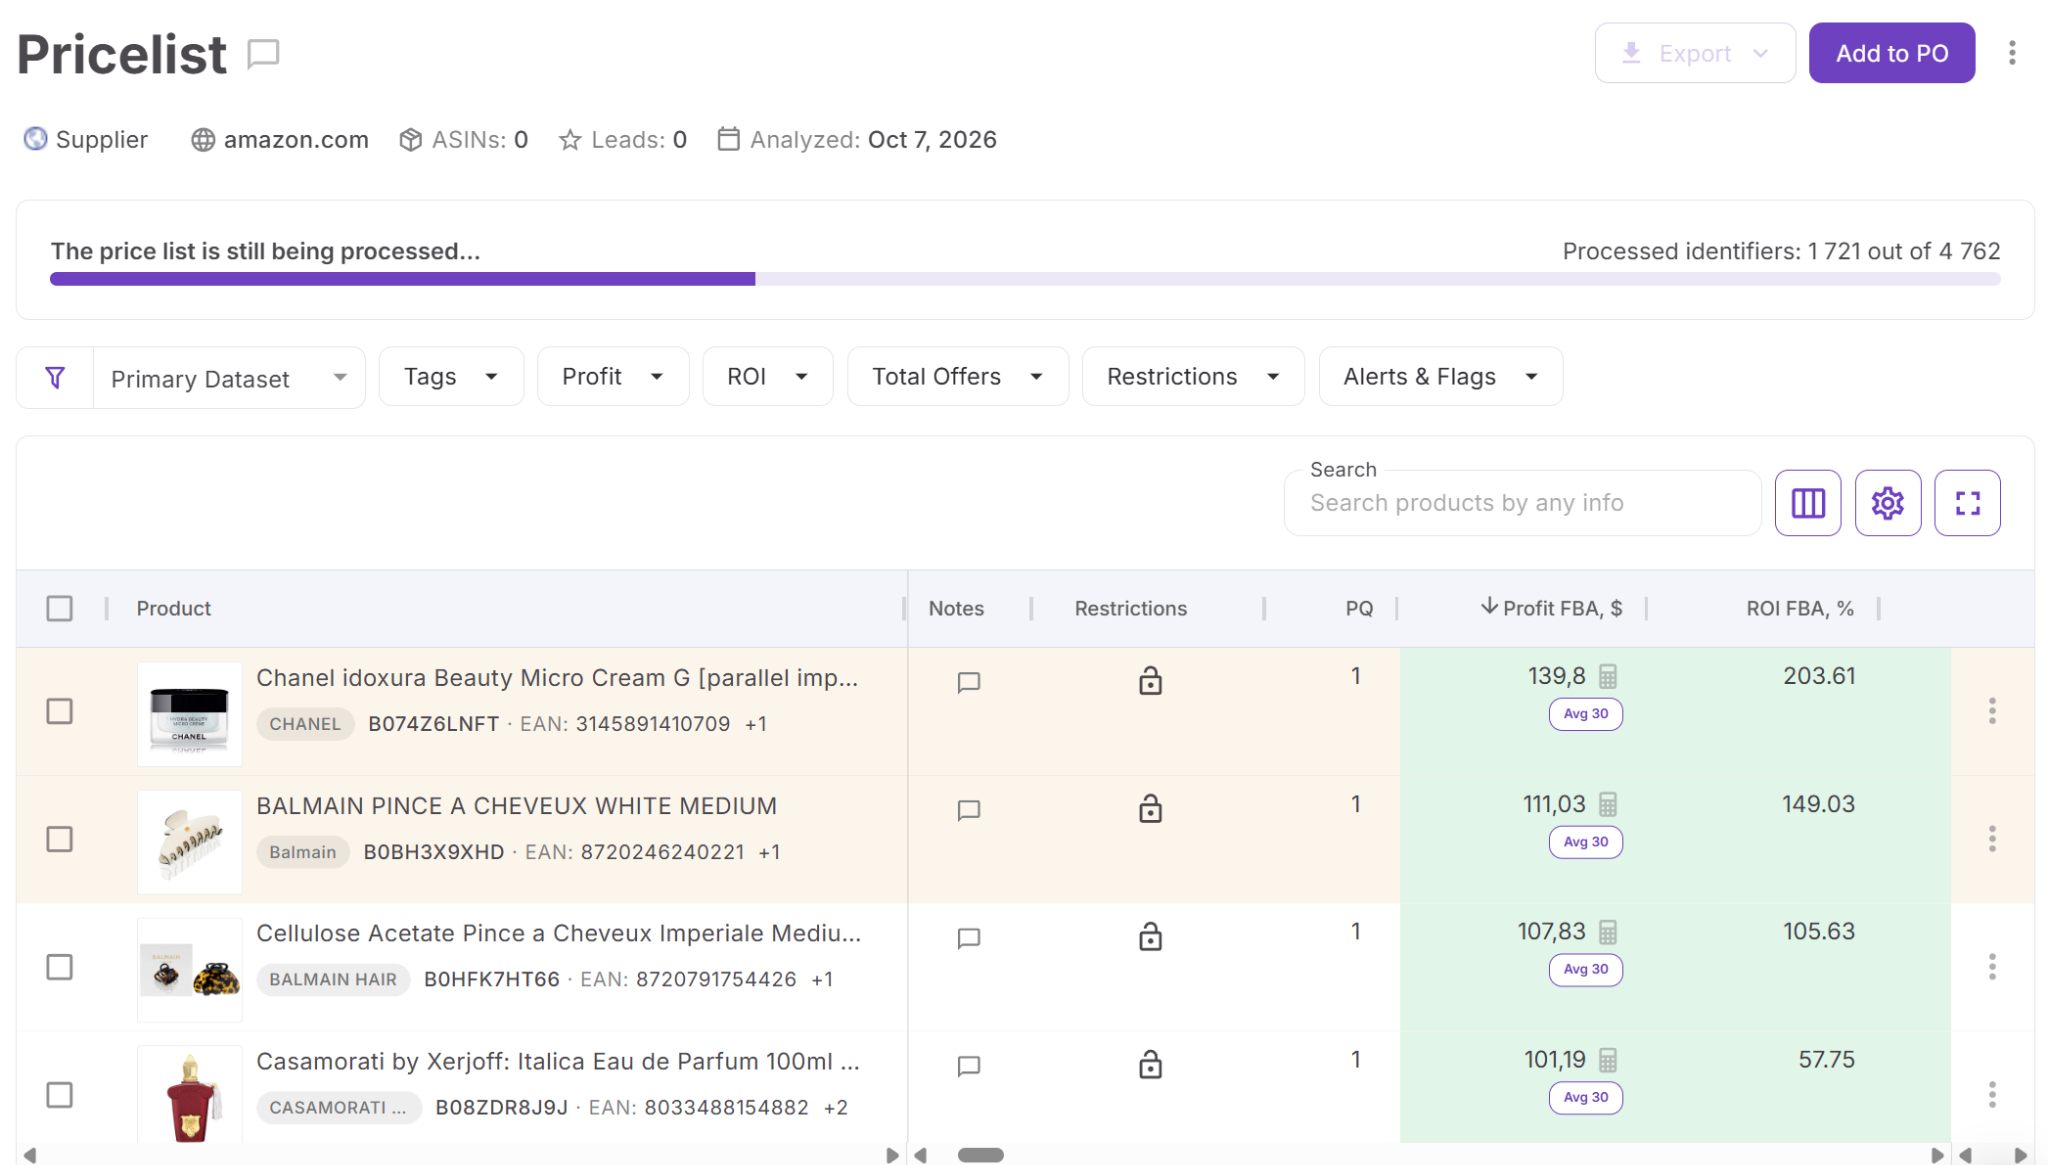
Step 3. Examine matched products
Open the analysis table to see which supplier items have been linked to Amazon ASINs. Results become available as processing progresses, so you can start checking matches and spotting incomplete or questionable listing data before the entire file is finished.
Step 4. Narrow the list by profit and sales
Filter products using your target ROI and demand requirements. To follow the research’s lead criteria, look for products with 20%–200% estimated ROI and at least five estimated monthly sales across the listing. Investigate unusually high returns to rule out incorrect matches or pack quantities.
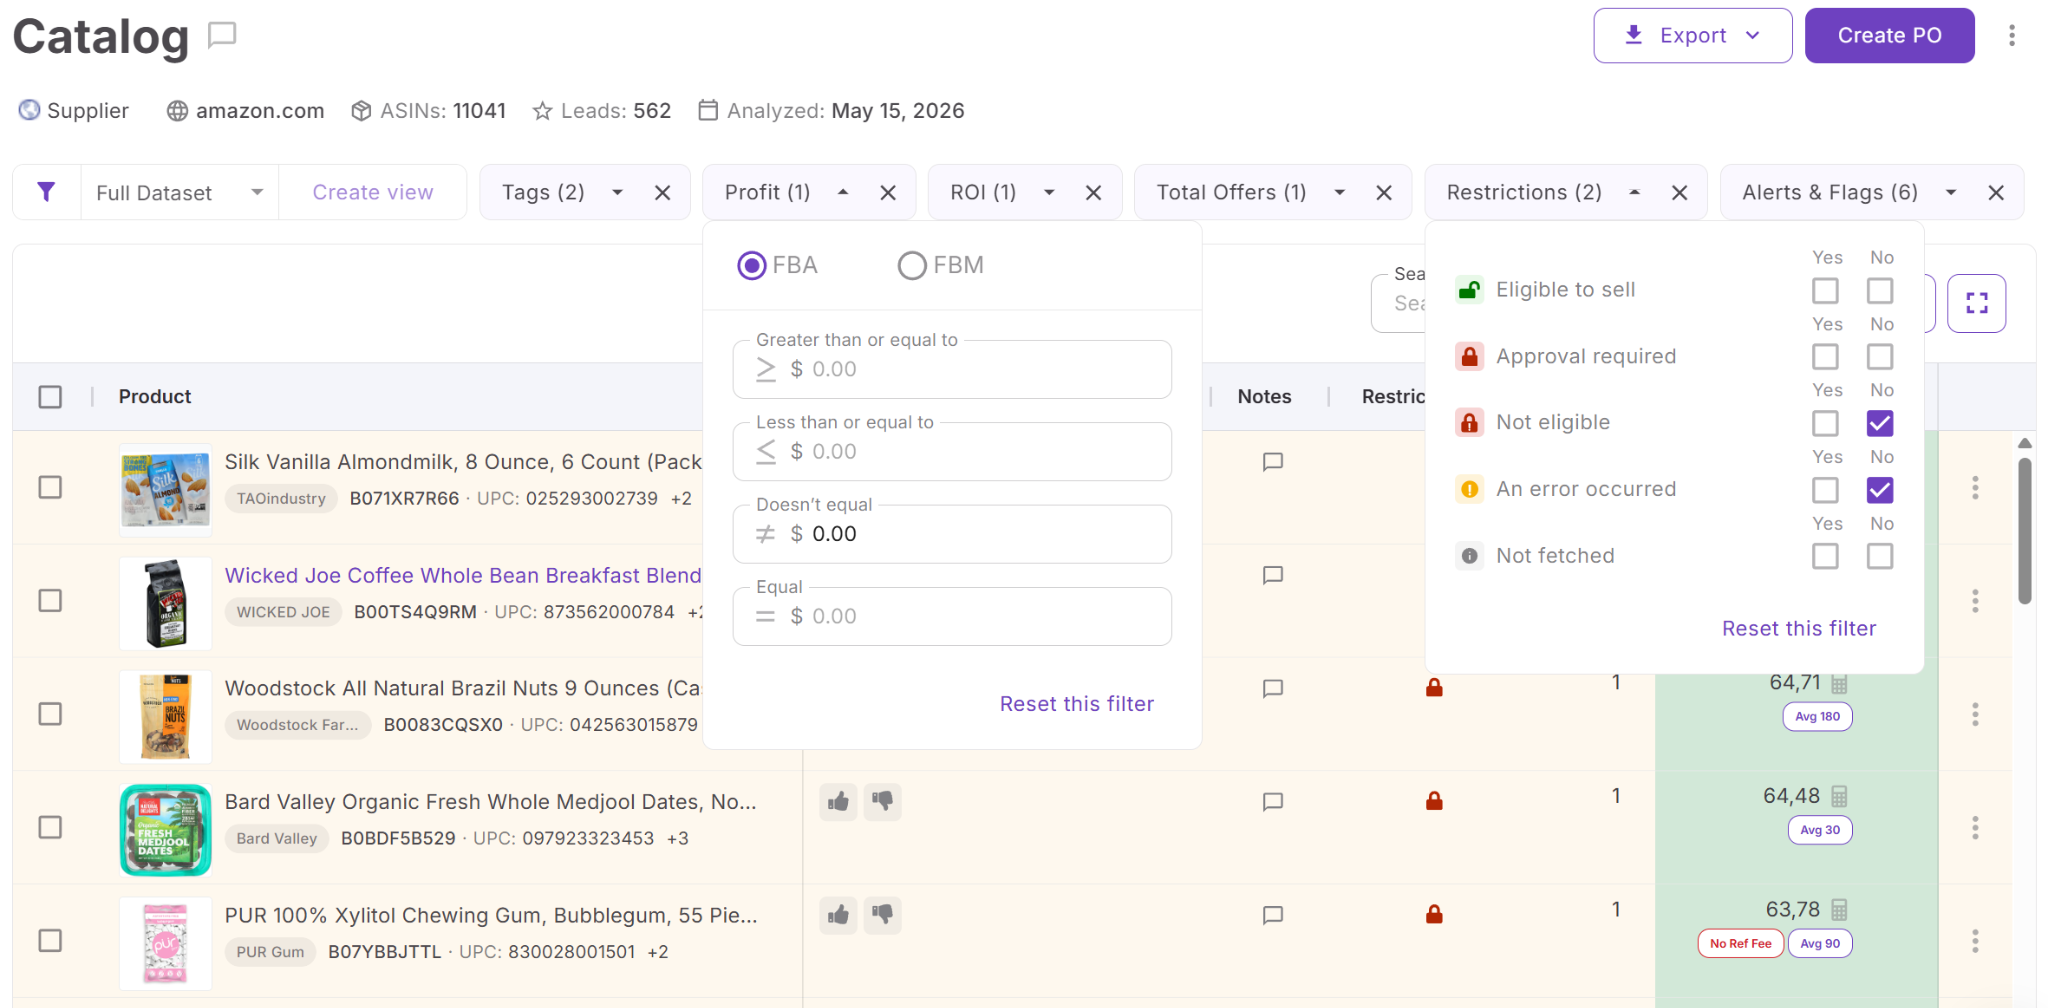
Step 5. Evaluate competition and product risks
Check whether Amazon holds the Buy Box, how many sellers compete on the listing, and whether any restrictions or IP-related warnings appear. Compare current and historical pricing, and revise sourcing costs if needed to see whether the estimated profit still meets your requirements.
Step 6. Organize and export your shortlist
Mark products worth investigating with tags, notes, or saved views. Download the filtered results for additional checks, or select Add to PO to transfer candidates into Seller Assistant’s purchase order workflow.
Before you place an order, verify pack quantities, supplier stock, your eligibility to sell the products, and the latest purchasing costs. Passing the filters makes a product a candidate for review, and each one still needs those checks.
FAQ
How often do wholesale suppliers raise prices?
When a supplier changes a price, about 2 times out of 3 it’s an increase, and the usual increase is about +10%. About 4 in 10 quotes stay the same to the cent from one year to the next.
How does a supplier price increase affect my Amazon leads?
A usual +10% increase cuts leads by about 24%, from 40.8 to 31.2 per 1,000 supplier lines. Many leads sit just above the 20% ROI line, so a small cost change pushes them below it.
Why don’t my margins show supplier price increases?
Margin gains and losses cancel out: 45% of products lost more than a point of margin while 43% gained one, so the median barely moved. A catalog-wide average hides the products that dropped below your ROI floor.
How much does a wholesale volume discount help?
A 10% volume discount adds about 29% more leads, from 40.8 to 52.7 per 1,000 supplier lines. Even a 5% discount adds about 14%.
How do I check my leads after a supplier price increase?
Re-scan the updated price list in Price List Analyzer using the same lead filters you used before, and drop only the lines that fell below 20% ROI. You can also edit the cost of goods to test a discount before you ask the supplier for it.
Final Thoughts
According to Seller Assistant’s State of Amazon Wholesale (Q3 2026), a wholesale supplier price increase is the most common price change: 2 of 3 changes are increases, usually about +10%. One such increase removes about 24% of your leads, while a 10% volume discount adds about 29%.
For your next reorder, that means:
- Expect the next quote to be higher, and compare it line by line with the last one.
- Read flat margin reports with care. Gains and losses cancel out, while individual products slip below your ROI floor.
- Re-check leads along with costs. A 10% increase costs you about a quarter of your buy list.
- Challenge each increase and ask for volume pricing on the lines you reorder most.
- Cut the lines that fell below your ROI floor before you drop a supplier, and set repricer floors at your new cost.
Price List Analyzer shows which leads survive a new quote in minutes. Start a free trial to re-check your next price list, or read the full report for category data and methodology.