

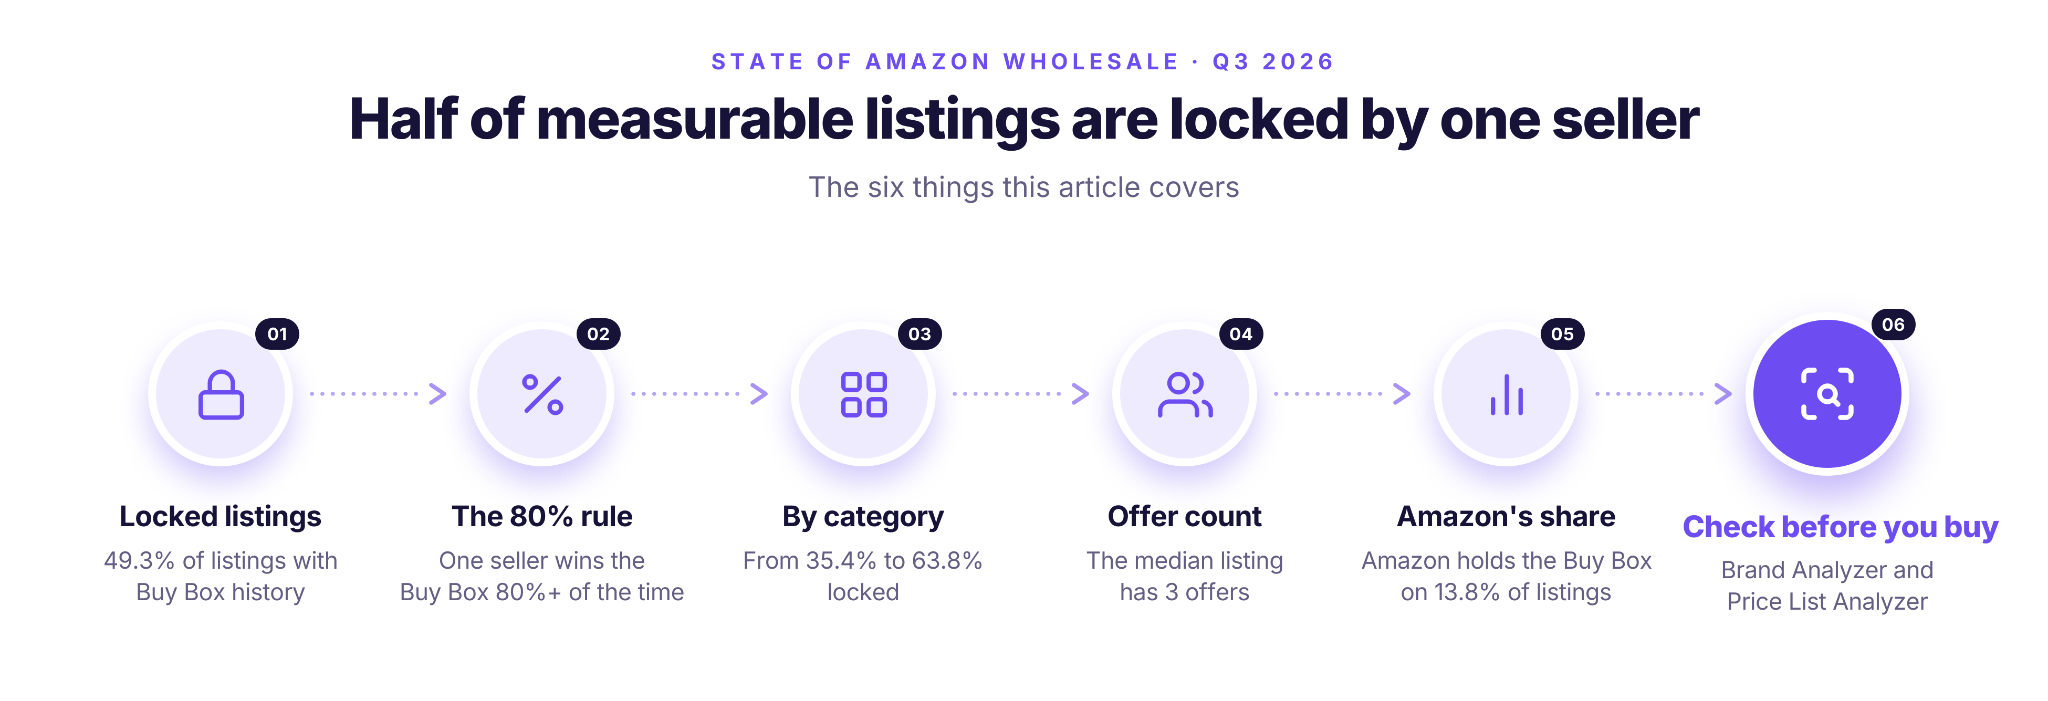
About half of the Amazon listings that we can measure are locked by one seller. According to Seller Assistant’s State of Amazon Wholesale (Q3 2026), 49.3% of listings with Buy Box history have one seller who wins the Buy Box 80% of the time or more. The median listing has only 3 offers, so the offer count says little about how hard a listing is to win. only the buy box history shows it.
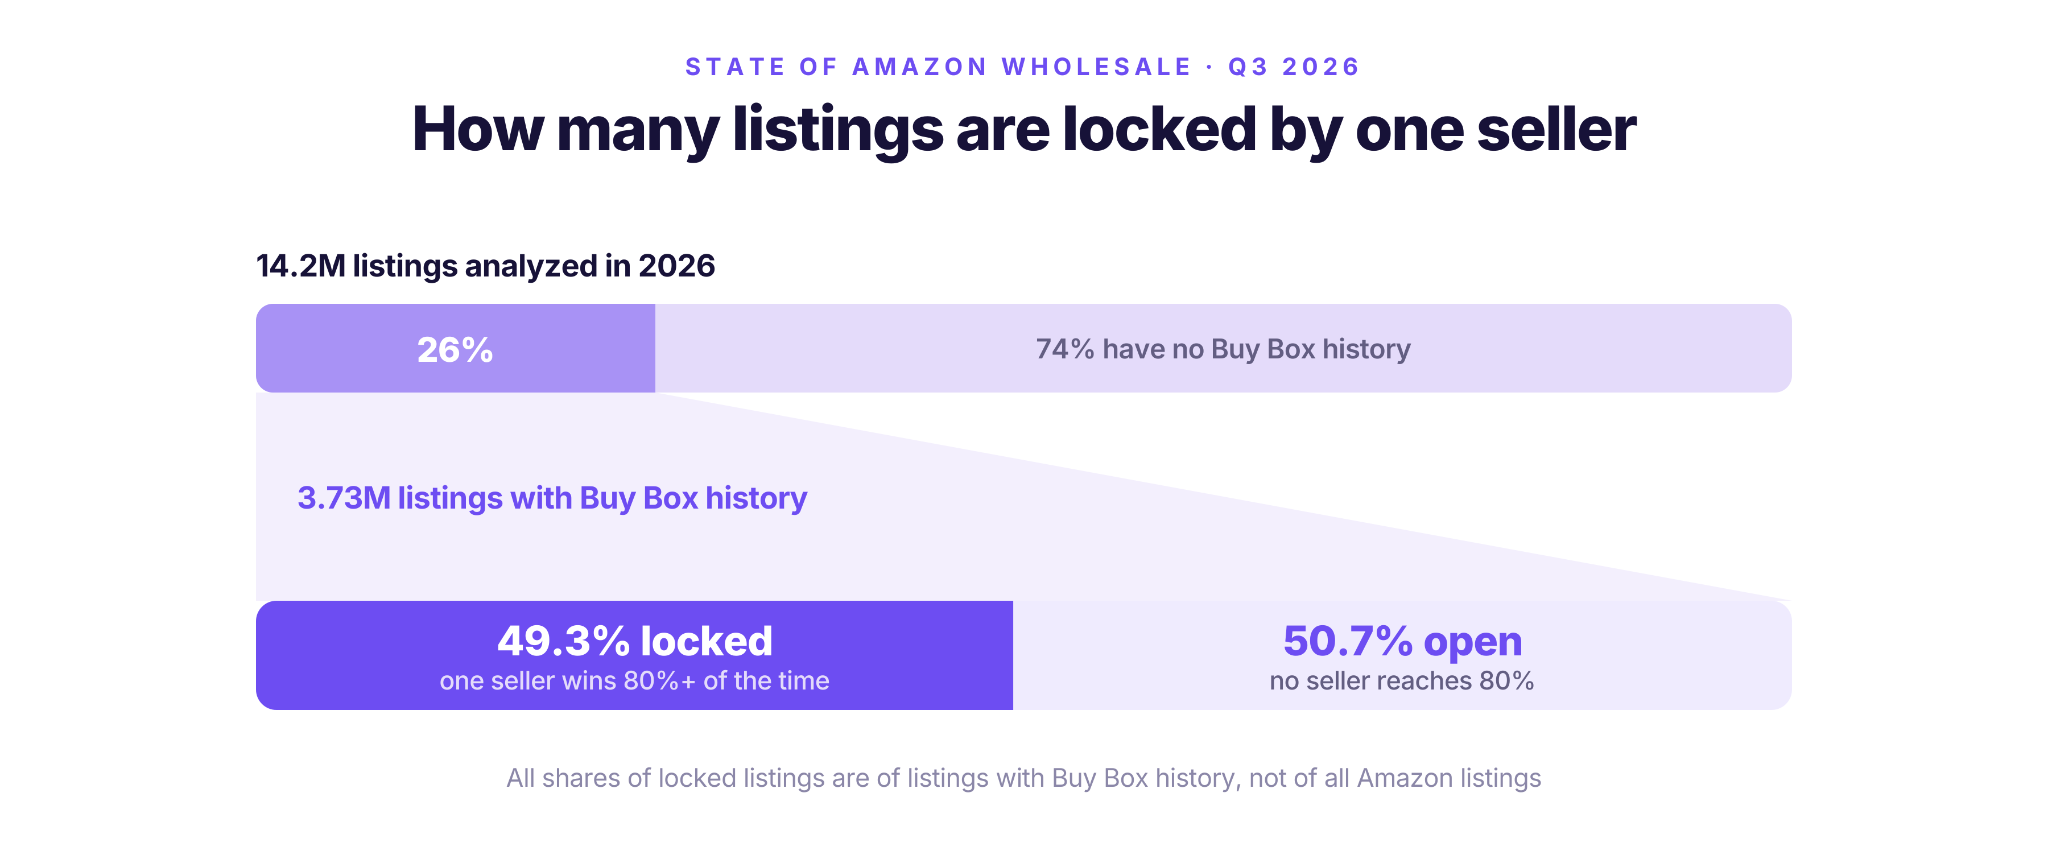
These Amazon Buy Box statistics come from the State of Amazon Wholesale report. They’re based on 14.2 million Amazon listings that matched the supplier price lists wholesale sellers scanned in Seller Assistant in 2026. Whether a listing is locked can be measured only on the 26% of those listings that have Buy Box history.
Methodology
| Item | Value |
|---|---|
| Source | Seller Assistant, State of Amazon Wholesale, Q3 2026, chapter 5 (competition and concentration) |
| Sample | 14.2 million Amazon listings analyzed from supplier price lists in 2026 (14,200,599). “Locked” is measurable only on the 26% of listings with Buy Box history (3,729,161 listings). All locked shares are calculated on measurable listings |
| Period and marketplace | Listings scanned in 2026, to August 2026. Amazon.com (US). The full report covers 13.5 million supplier lines from 782 verified wholesale sellers, July 2025 to August 2026 |
| Definitions | Locked listing: one seller wins the Buy Box 80% of the time or more. Amazon on Buy Box: the share of listings where Amazon holds the Buy Box. Est. units: the median sales estimate of the listings that have an estimate above zero |
| Year-over-year context | Offer counts and Amazon’s Buy Box presence compare the same 504,282 repeat products in H2 2025 and 2026 (chapter 6). Amazon’s share there counts products where Amazon held the Buy Box on more than half of the scans, so it differs from the Amazon on Buy Box column |
| Baseline | This is the 2026 baseline. No earlier data is available for comparison, so there is no year-over-year claim for locked share |
| Exclusions | Demo, test and staff accounts. No statistic is based on fewer than 5 sellers |
How Many Amazon Listings Are Locked by One Buy Box Seller?
Nearly half of the listings we could measure are locked. In 49.3% of listings with Buy Box history, one seller wins the Buy Box 80% of the time or more. The share ranges from 35.4% in Video Games to 63.8% in Books, so even the most open category has more than a third of its listings locked.
Key stats
- According to Seller Assistant’s State of Amazon Wholesale (Q3 2026), 49.3% of Amazon listings with Buy Box history are locked: one seller wins the Buy Box 80% of the time or more.
- According to Seller Assistant’s State of Amazon Wholesale (Q3 2026), the median Amazon listing has 3 offers, and the number of offers did not increase year over year.
What the numbers cover
- Measurable listings only. 26% of the 14.2 million listings have Buy Box history. The rest can’t be classified, so the locked share says nothing about them.
- A 2026 baseline. There’s no earlier measurement, so the locked share is a level for 2026.
- Typical demand. The median listing with a sales estimate sells about 54 units a month (estimated).
What a Locked Listing Is
A listing is locked when one seller wins the Buy Box 80% of the time or more. A seller’s buy box share, often called the buy box percentage or win rate, is the percentage of time that seller holds the Buy Box. For how the Buy Box itself works, see how the Amazon Buy Box works.
What locked means in practice
- The other sellers share 20% or less. On a locked listing with ten sellers, nine sellers share what’s left, about 2% each on average.
- The Buy Box barely rotates. On an open listing, Amazon Buy Box rotation moves the Buy Box between several sellers. On a locked listing, it stays with one seller most of the time, so other offers are shown much less often.
- The offer count says little. A listing can be locked with 3 offers, or open with 12. The offer count section below shows how.
On an open listing, the Buy Box can change hands often, so it helps to track Buy Box changes after you start selling.
Locked Buy Box Share by Category
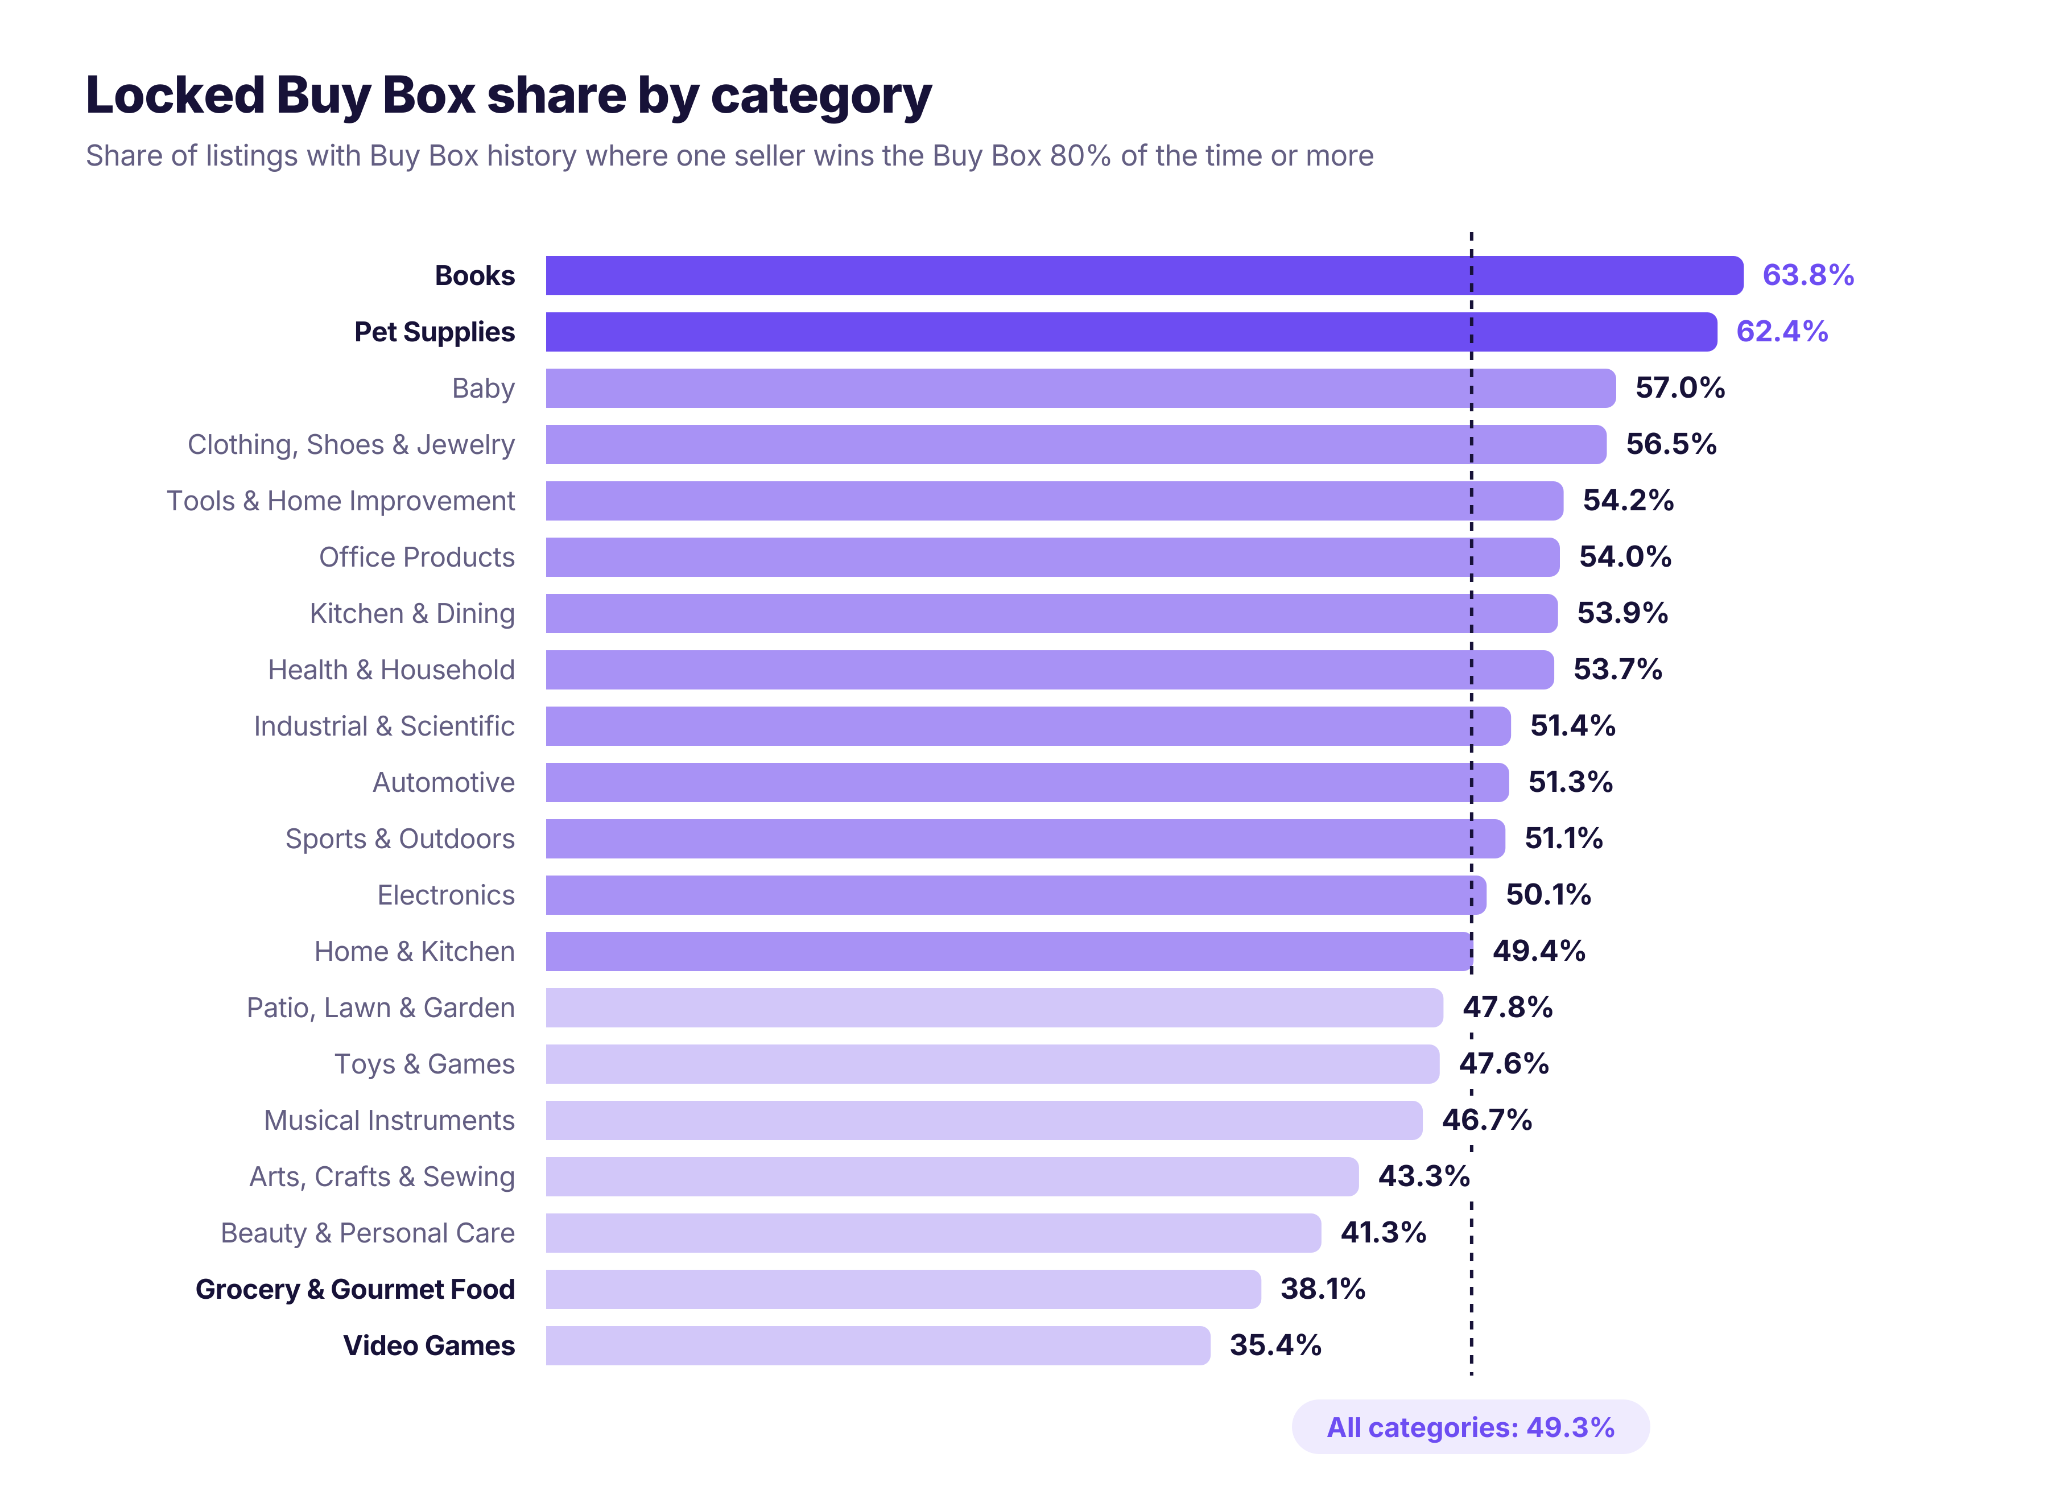
How often one seller dominates the Buy Box depends heavily on the category. According to Seller Assistant’s State of Amazon Wholesale (Q3 2026), Pet Supplies (62.4%) and Books (63.8%) have the most locked listings, and Video Games (35.4%) and Grocery & Gourmet Food (38.1%) the fewest.
| Category | Median offers | Locked share | Amazon on Buy Box | Est. units a month per listing |
|---|---|---|---|---|
| All categories | 3 | 49.3% | 13.8% | 54 |
| Books | 10 | 63.8% | 26.7% | 13 |
| Pet Supplies | 3 | 62.4% | 22.5% | 68 |
| Baby | 2 | 57.0% | 23.9% | 149 |
| Clothing, Shoes & Jewelry | 1 | 56.5% | 14.3% | 51 |
| Tools & Home Improvement | 6 | 54.2% | 17.0% | 38 |
| Office Products | 6 | 54.0% | 21.6% | 51 |
| Kitchen & Dining | 2 | 53.9% | 21.6% | 57 |
| Health & Household | 4 | 53.7% | 12.7% | 61 |
| Industrial & Scientific | 6 | 51.4% | 15.0% | 52 |
| Automotive | 5 | 51.3% | 13.4% | 52 |
| Sports & Outdoors | 3 | 51.1% | 15.8% | 51 |
| Electronics | 5 | 50.1% | 16.1% | 53 |
| Home & Kitchen | 2 | 49.4% | 14.8% | 53 |
| Patio, Lawn & Garden | 4 | 47.8% | 11.6% | 51 |
| Toys & Games | 5 | 47.6% | 25.3% | 50 |
| Musical Instruments | 3 | 46.7% | 15.2% | 51 |
| Arts, Crafts & Sewing | 3 | 43.3% | 11.1% | 52 |
| Beauty & Personal Care | 4 | 41.3% | 12.5% | 70 |
| Grocery & Gourmet Food | 3 | 38.1% | 12.0% | 113 |
| Video Games | 12 | 35.4% | 14.4% | 72 |
Locked share is of listings with Buy Box history. Est. units is the median of the listings with a sales estimate above zero. In Books, few listings have one, so read its 13 units with care.
The most locked categories
- Books (63.8%) has 10 offers at the median, yet nearly two in three measurable listings are locked.
- Pet Supplies (62.4%) has only 3 offers at the median, and 62.4% of its measurable listings are locked.
- Baby (57.0%) combines a high lock rate with the highest sales per listing in the table (149 units a month, estimated).
- Clothing, Shoes & Jewelry (56.5%) has a median of just 1 offer, and more than half its listings are locked.
The most open categories
- Video Games (35.4%) has the most offers per listing (12) and the lowest locked share.
- Grocery & Gourmet Food (38.1%) is the second most open category, and the only one where offer counts increased year over year, so expect more competition.
- Beauty & Personal Care (41.3%) and Arts, Crafts & Sewing (43.3%) are also well below the overall 49.3%.
Why the Offer Count Doesn’t Show the Competition
The number of offers tells you how many sellers are on a listing. It says nothing about how often each one wins. Three categories show the gap.
| Category | Median offers | Locked share |
|---|---|---|
| Video Games | 12 | 35.4% |
| Books | 10 | 63.8% |
| Pet Supplies | 3 | 62.4% |
Video Games and Books have a similar number of offers, but a Books listing is almost twice as likely to be locked. Pet Supplies has a quarter of the offers Video Games has and is still far more locked. A listing with few offers can be harder to win than a crowded one, and only the Buy Box history shows which is which.
Offer counts didn’t increase
On the same products, the median offer count didn’t change year over year. Where it moved, it mostly fell:
- Arts, Crafts & Sewing: -12.6%
- Office Products: -4.7%
- Toys & Games: -4.0%
- Electronics: -3.9%
- Books: -3.9%
- Video Games: -1.7%
- Grocery & Gourmet Food: +2.8%, the only increase
A listing with fewer sellers is still hard to win when one of them holds the buy box most of the time.
Amazon on the Buy Box
Amazon holds the Buy Box on 13.8% of listings overall, but its presence varies a lot by category:
- Most present: Books (26.7%), Toys & Games (25.3%), Baby (23.9%) and Pet Supplies (22.5%).
- Least present: Arts, Crafts & Sewing (11.1%), Patio, Lawn & Garden (11.6%) and Grocery & Gourmet Food (12.0%).
Where Amazon holds the Buy Box often, expect it to be hard to get a share of sales on those listings, however few other sellers there are.
Amazon is slightly less present than a year ago
A second measure follows the same 504,282 repeat products over time and counts those where Amazon held the Buy Box on more than half of the scans. Because it uses a different sample and definition, its numbers are higher than the 13.8% above.
- On this measure, Amazon’s share fell from 23.4% to 22.1%, so Amazon left about 1 in 80 repeat listings, net.
- The largest drops were in Video Games (-6.7 points), Toys & Games (-6.3) and Books (-4.0). Baby is the only category where Amazon’s share rose (+0.2).
How to Check Buy Box Concentration Before You Buy
You can check how concentrated the Buy Box is at two levels before you place an order: line by line in a supplier price list with Price List Analyzer, or across a whole brand with Brand Analyzer. Price List Analyzer shows the top seller’s buy box share and how often Amazon holds it. Brand Analyzer shows how often Amazon holds it across a brand. Together they help you spot listings where one seller dominates before you buy.
For a supplier price list: Price List Analyzer
Price List Analyzer matches each line of a supplier file to its Amazon listing and adds the Buy Box data you need to judge concentration.
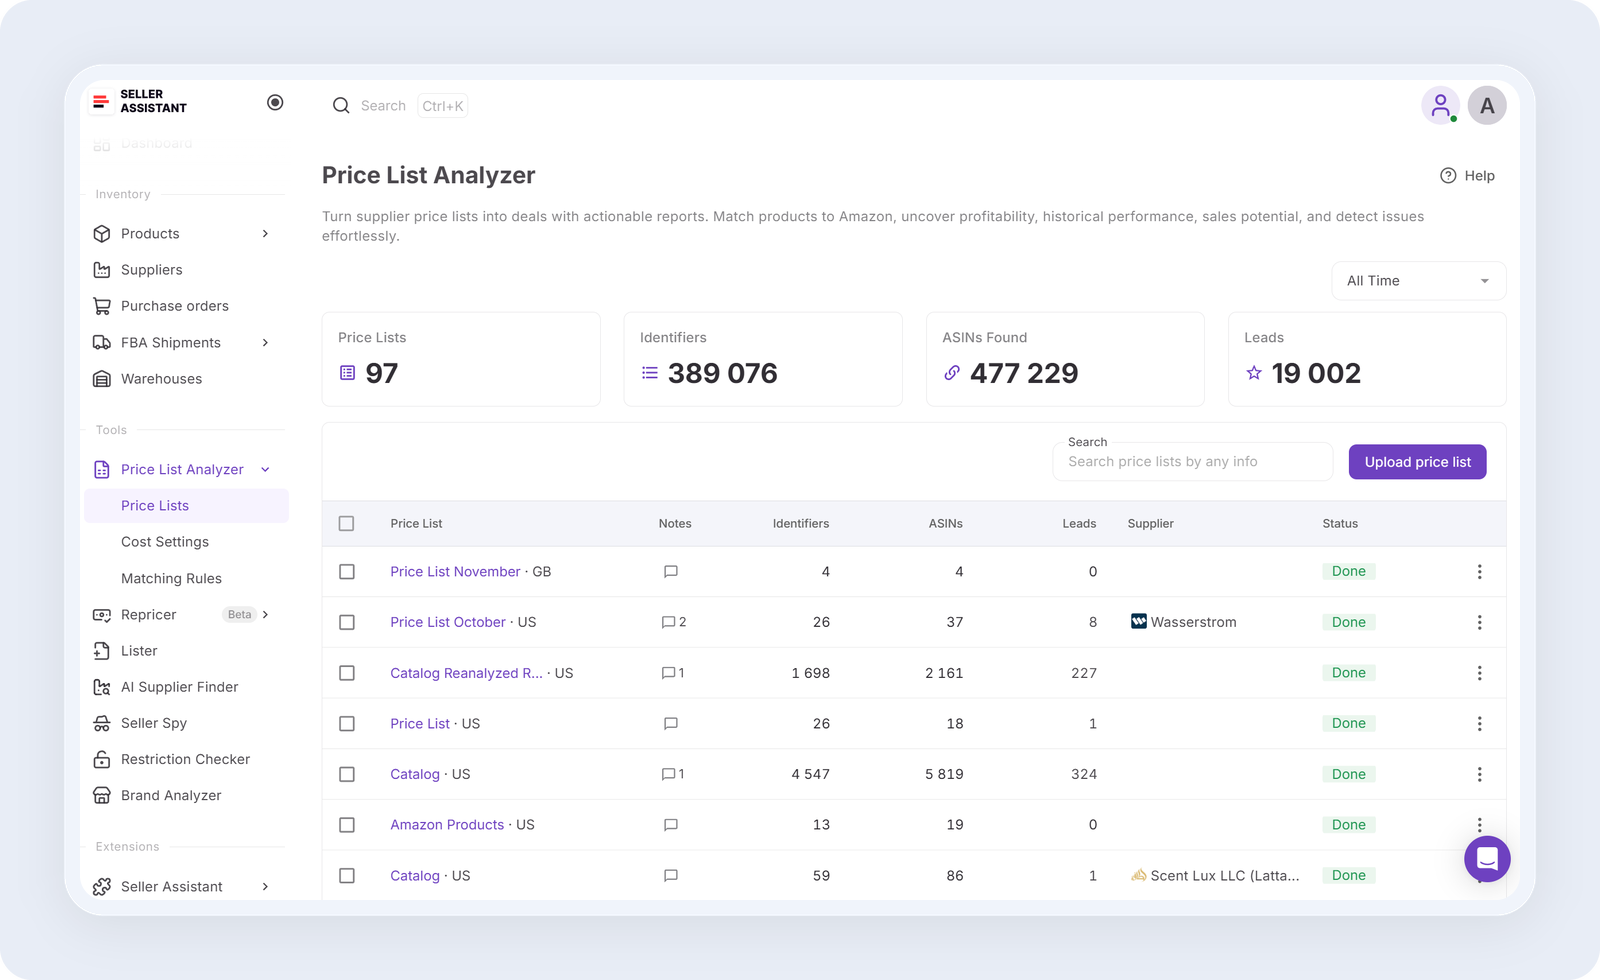
- The top seller’s Buy Box share: how much of the time the leading seller wins.
- Amazon’s Buy Box share: how often Amazon holds it.
- Buy Box-eligible offers next to total offers: how many sellers actually compete for the Buy Box.
- Top Seller FBA and Top Seller FBM filters: whether the leading seller ships through FBA or fulfills its own orders.
How to use it
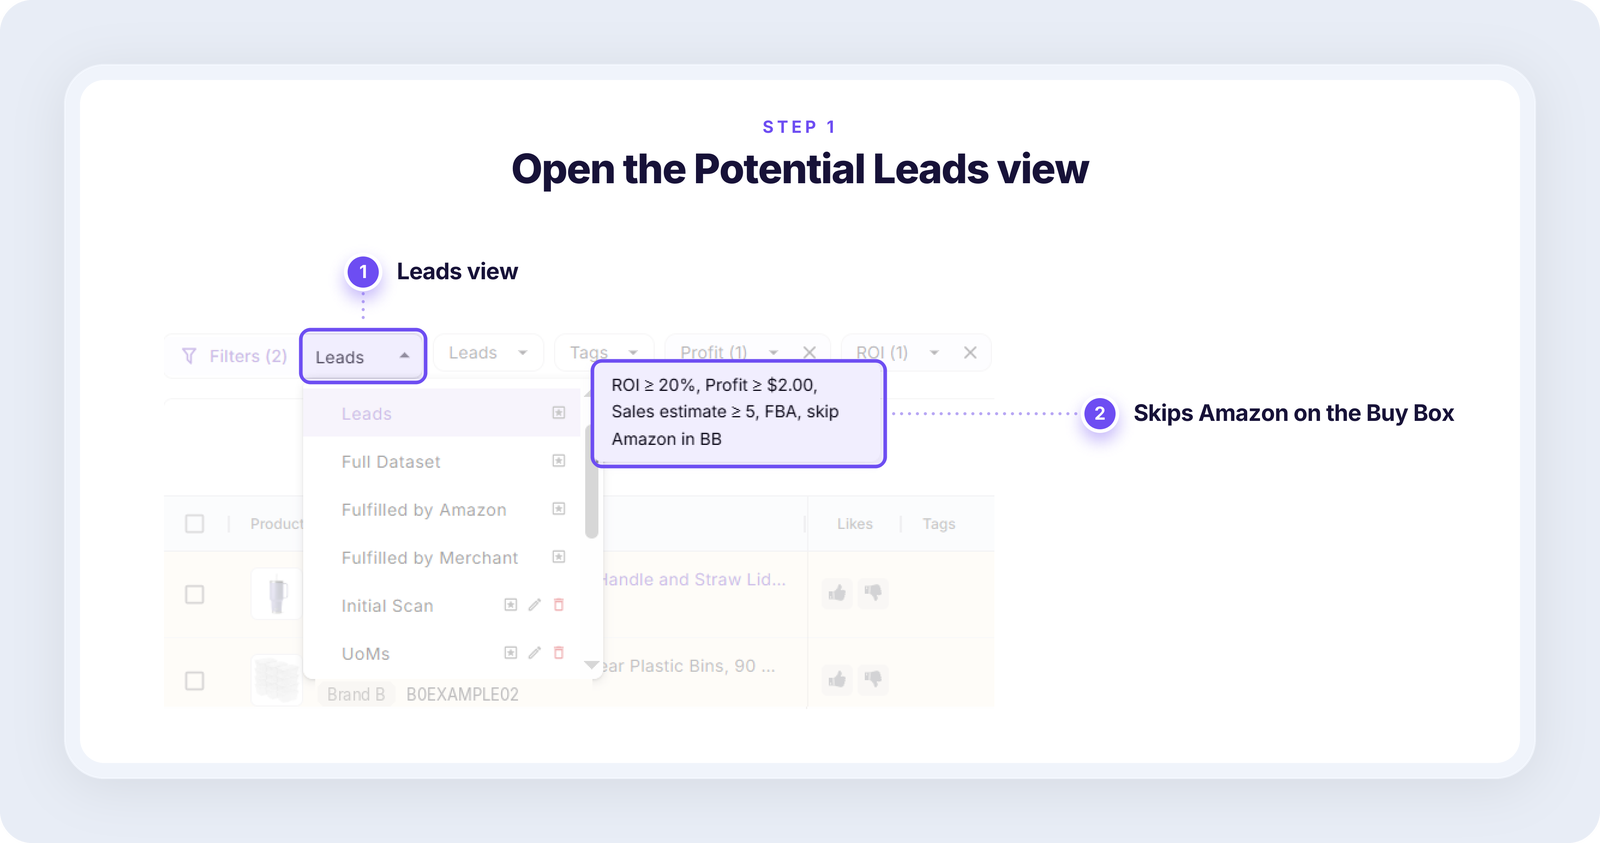
Step 1. Open the Potential Leads view
Its default rules already skip listings where Amazon has the Buy Box.
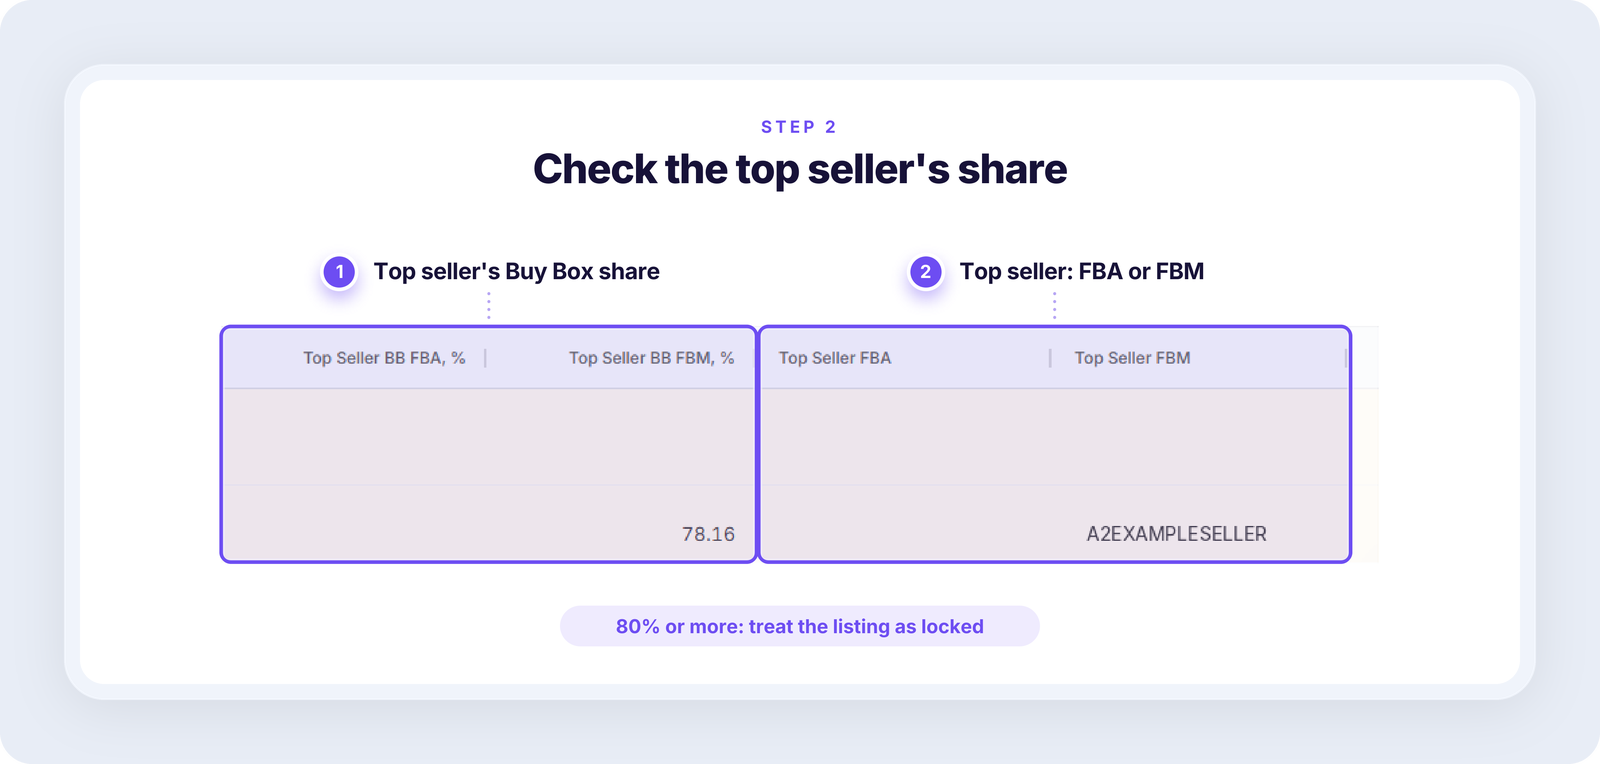
Step 2. Check the top seller’s share
If one seller wins 80% of the time or more, treat the listing as locked.
Step 3. Choose candidates
Keep the open listings, and weigh the locked ones with their sales and margin before you buy.
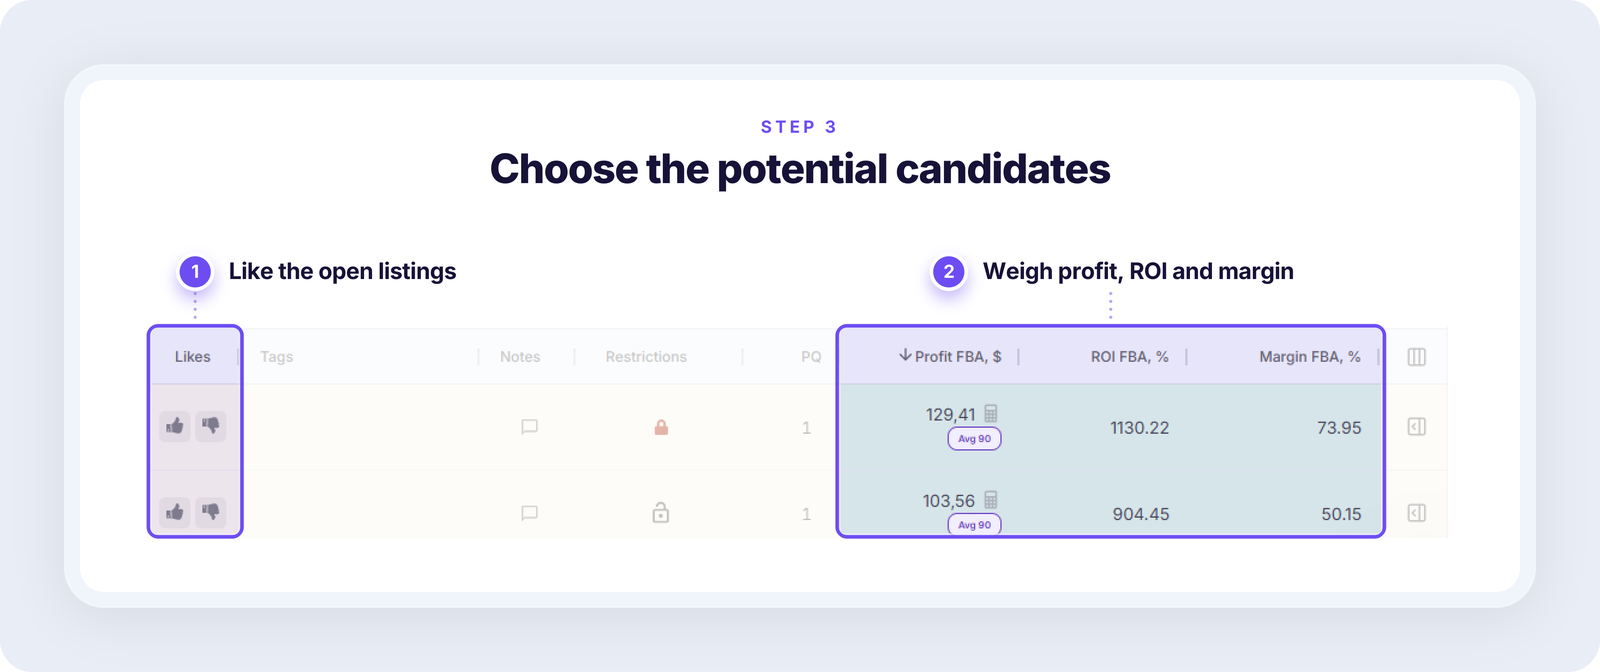
This narrows a list fast, which matters because only a few lines in a typical file are worth buying. See how many price list lines become leads.
For a whole brand: Brand Analyzer
Brand Analyzer checks Amazon’s Buy Box presence and competition across all of a brand’s products before you ask a supplier for a price list. It shows:
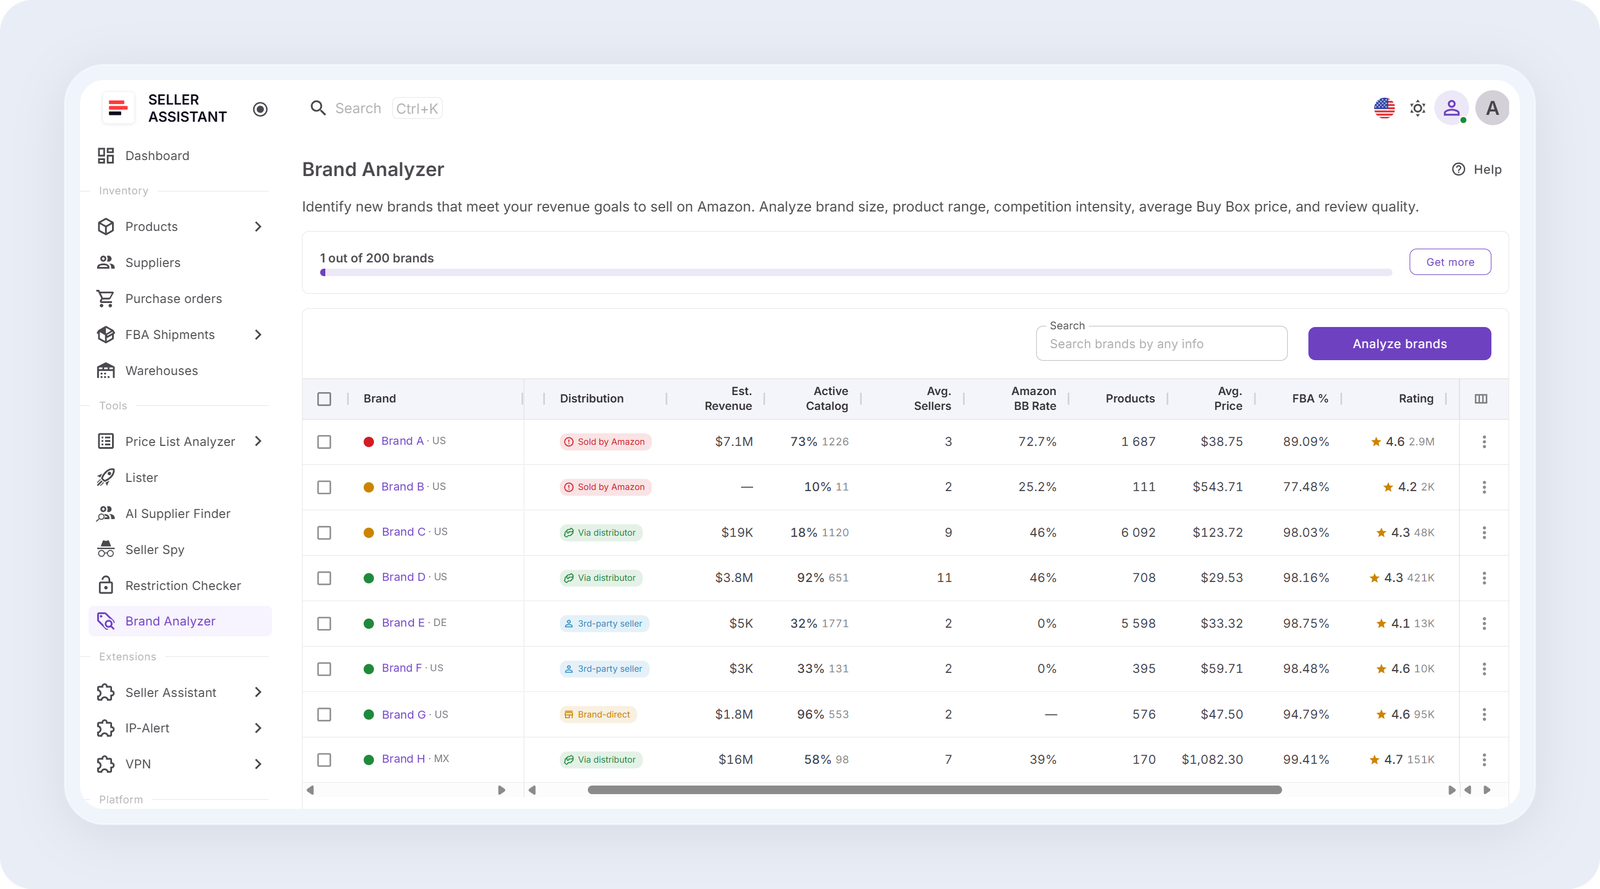
- Distribution: how the brand reaches Amazon, for example via distributor, sold by Amazon or brand-direct.
- Amazon BB rate: how often Amazon holds the Buy Box on the brand’s listings.
- Average sellers per listing and unique sellers: how many sellers compete across the brand.
- Amazon presence: the share of the brand’s listings where Amazon sells.
How to use it
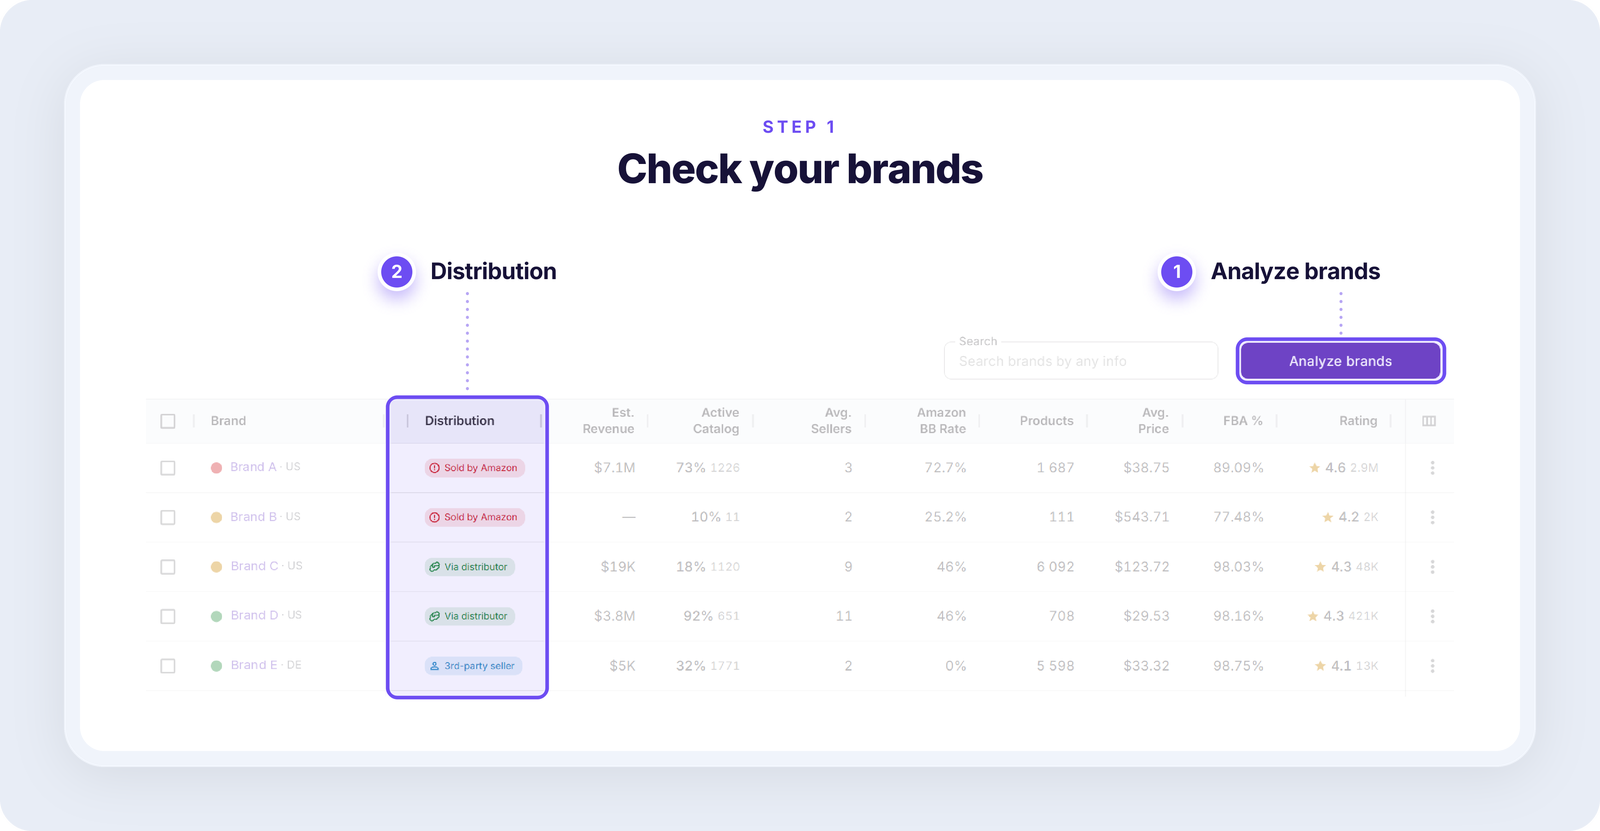
Step 1. Check your brands
Click “Analyze brands” and add the brands you want to check. The Distribution column shows how each brand is sold, and each brand gets a resale potential score out of 9.
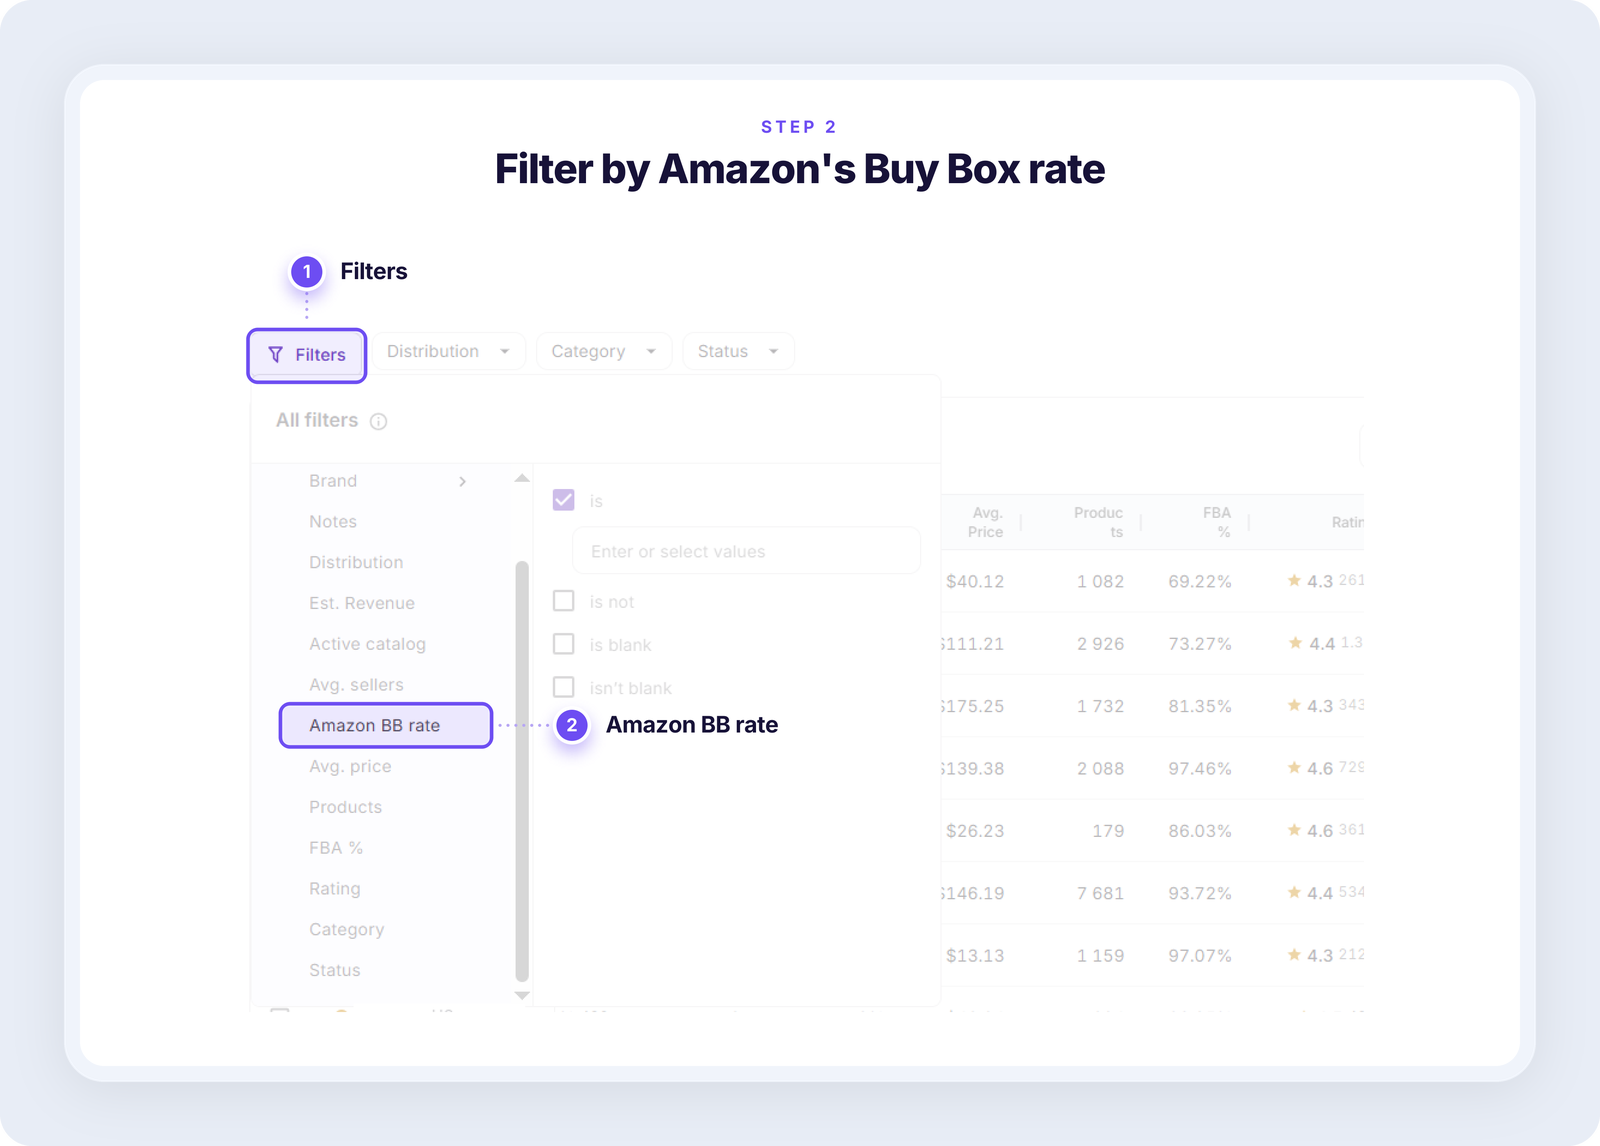
Step 2. Filter by Amazon’s Buy Box rate
Open Filters and set a limit for Amazon BB rate. This removes the brands where Amazon wins most of the time, because those listings leave little room for resellers.
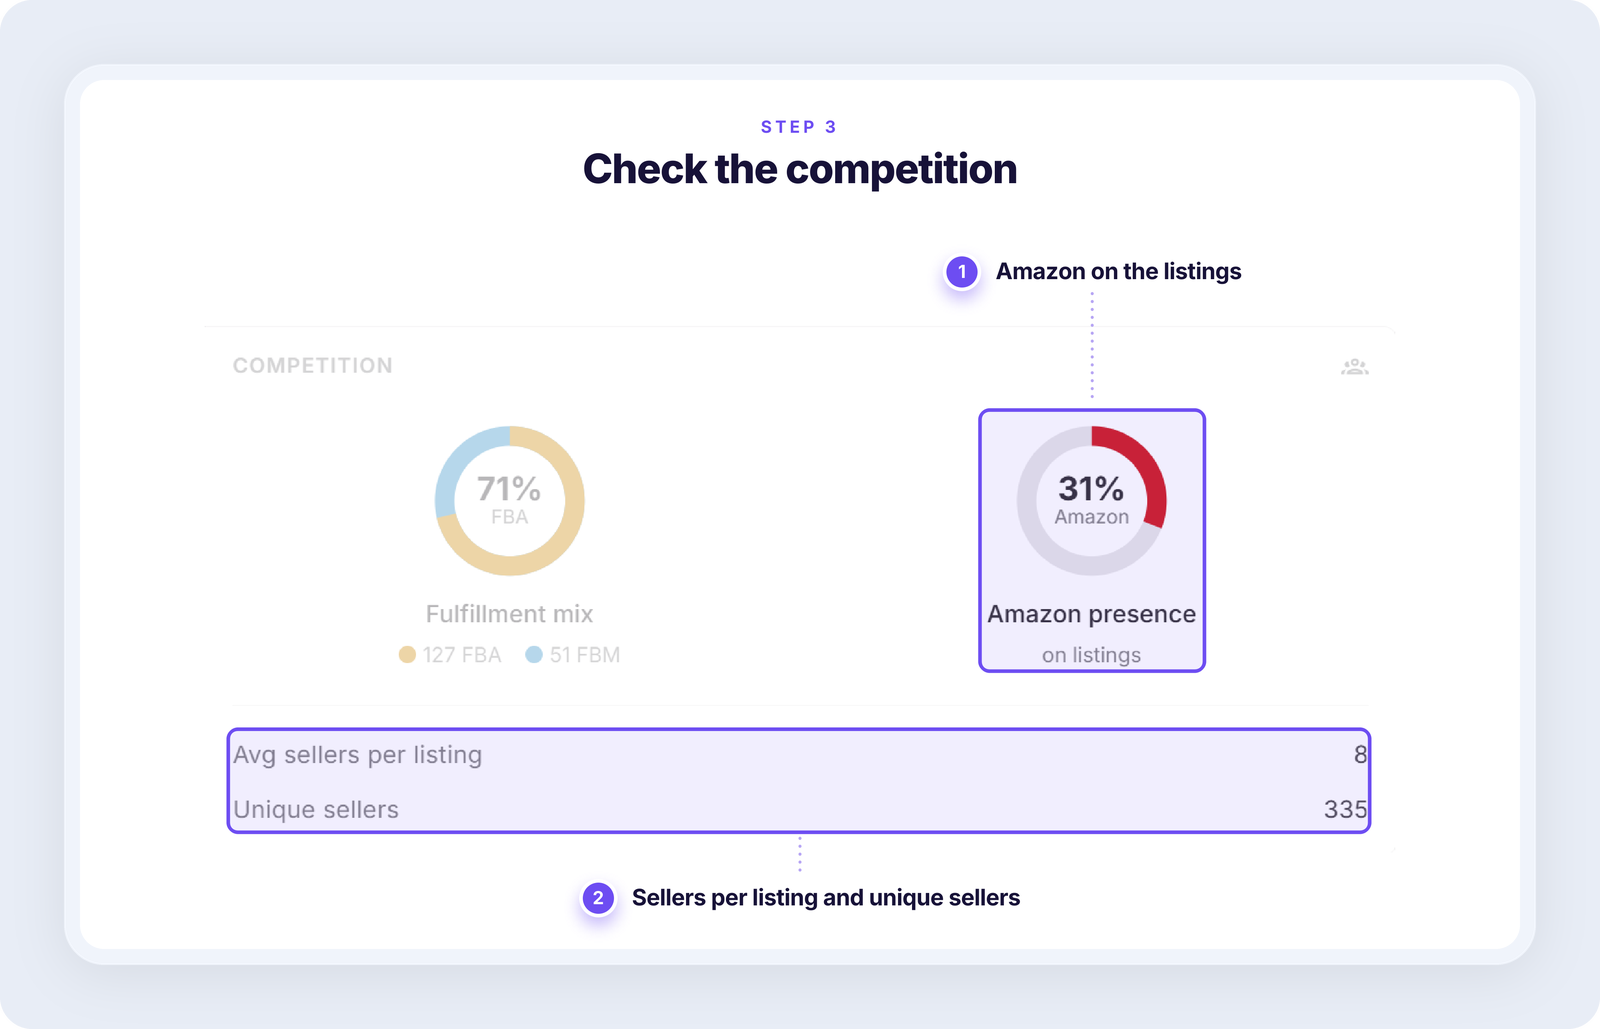
Step 3. Check the competition
Open a brand and look at its Competition panel. Several sellers per listing and a low Amazon presence are only a first screen, because offer counts don’t show who wins the Buy Box. Then find a supplier and check its price list line by line.
Brand Analyzer screens brands for a supplier search. Price List Analyzer then shows which products to buy.
FAQ
What is a good Buy Box percentage on Amazon?
It depends on how many sellers compete on the listing, so there is no single target. In Seller Central, business reports show your Featured Offer (Buy Box) percentage for each ASIN. Judge it against the listing’s competition: on a locked listing, every seller except the top one will see a low percentage.
What is the Amazon Buy Box rotation?
Rotation means that Amazon moves the Buy Box between eligible sellers whose offers are similar in price, fulfillment and performance. It happens on listings that no single seller controls. In the report, the other 50.7% of listings with Buy Box history have no seller above 80%, so rotation is possible there.
What is the difference between Buy Box win rate and Buy Box share?
The two terms mean the same thing: the percentage of time a seller holds the Buy Box. The report measures it for the leading seller on each listing, and Seller Central shows it for your own offers. Check the leading seller’s share before you buy, and track your own after you start selling.
Where can I see Buy Box statistics for a listing?
Tools such as Keepa show a listing’s Buy Box history and statistics, one product at a time. Business reports in Seller Central cover only your own offers.
Should I avoid listings where Amazon holds the Buy Box?
Price List Analyzer’s potential leads view skips them by default. If you want to consider one, check its price history and the top seller’s share first.
What Buy Box Concentration Means for Your Sourcing
In 2026, 49.3% of listings with Buy Box history were locked by one seller who won the Buy Box 80% of the time or more. The median listing has only 3 offers, but the offer count doesn’t show who wins. Check the Buy Box history before you buy: screen brands in Brand Analyzer, then check each product in a supplier price list with Price List Analyzer.
How to cite
Seller Assistant, State of Amazon Wholesale, Q3 2026, chapter 5 (competition and concentration). 14.2 million Amazon listings from supplier price lists scanned in 2026, Amazon.com (US). Available at State of Amazon Wholesale report.
Example: “According to Seller Assistant’s State of Amazon Wholesale (Q3 2026), 49.3% of Amazon listings with Buy Box history are locked: one seller wins the Buy Box 80% of the time or more.”