

To see Amazon profit by SKU in Seller Assistant Profitability, pick a marketplace and a period, add costs for any units that have none, then drill down from a brand to its suppliers and products, and open the SKU table. You’ll see each SKU’s sales, costs, fees and net profit for that period, so you can decide what to reorder from each supplier.
This guide walks through those steps one screen at a time. By the end, you’ll know which brands, suppliers and SKUs made money in the period you chose, and which ones only looked profitable when you bought them.
What Profitability in Seller Assistant Shows
Profitability shows your Amazon profit after the sale. It reads your orders, refunds and Amazon fees from your seller account, subtracts the product costs on your SKUs, and shows what’s left for any period you pick.
How the page is organized
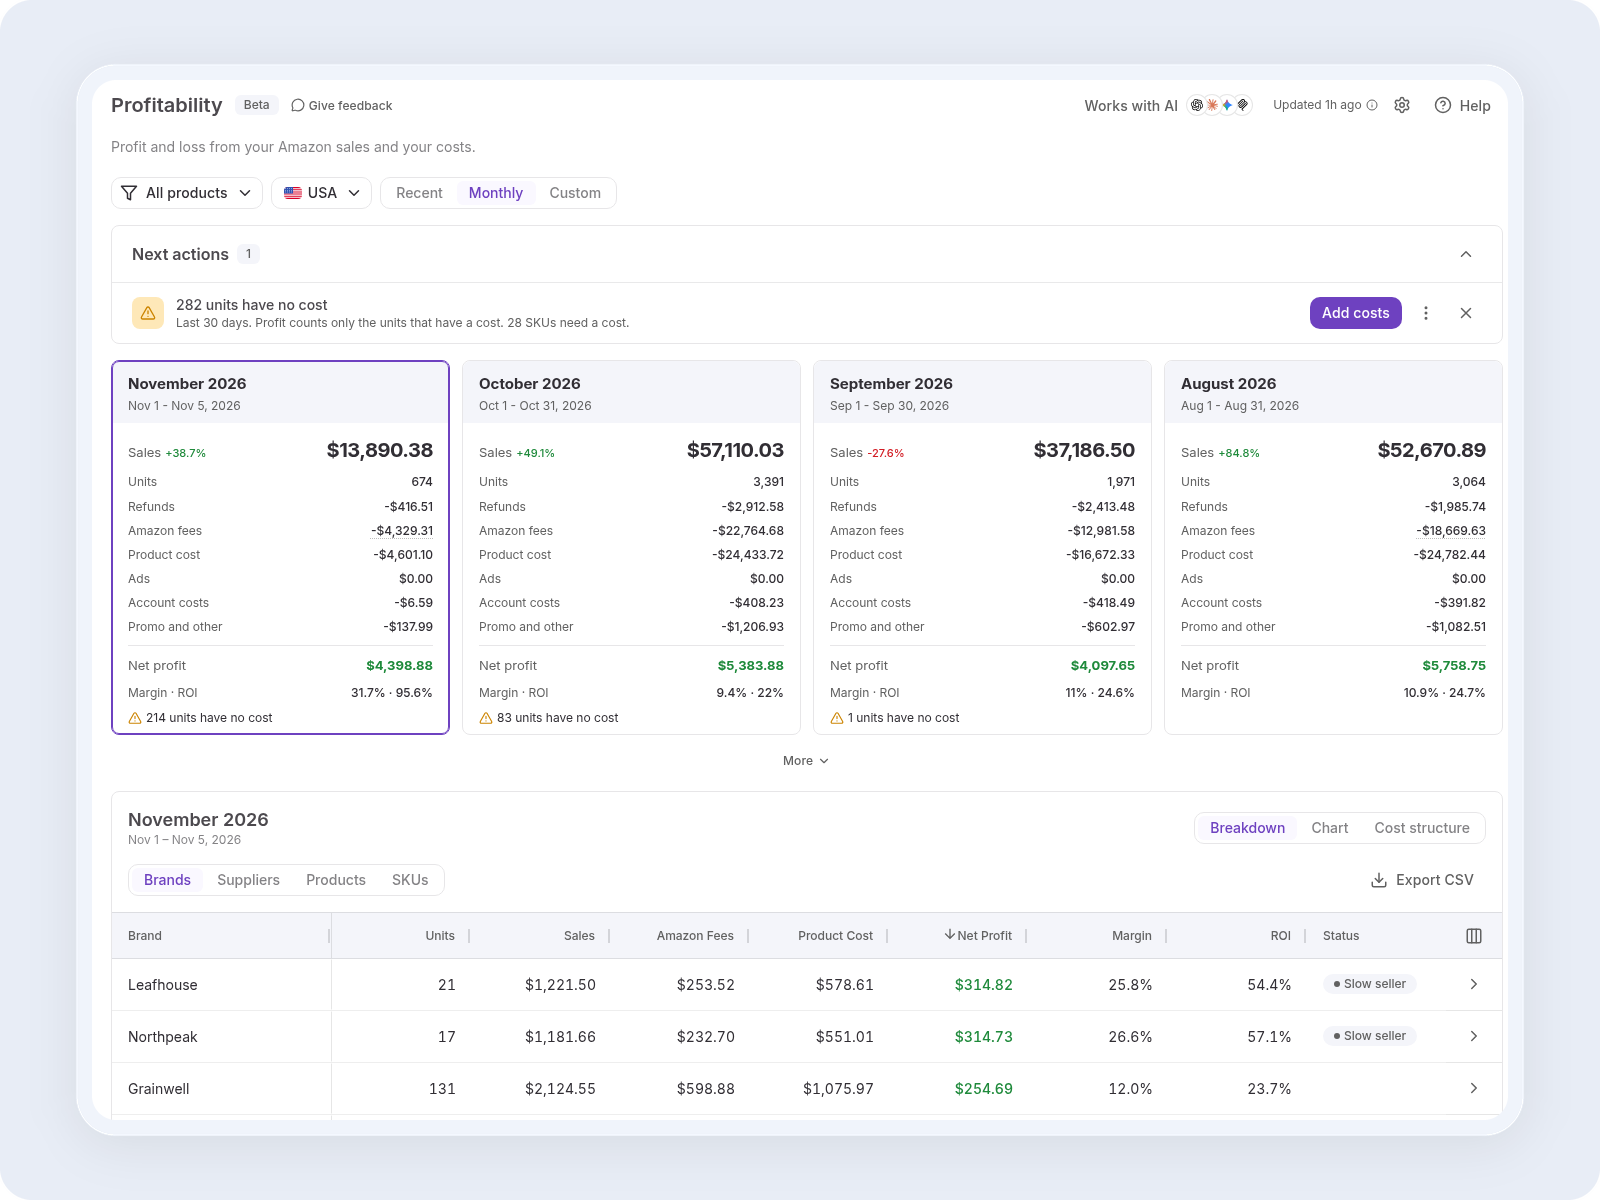
- Overview: period cards with sales, units, refunds, Amazon fees, product cost, ads, account costs, and promo and other, adding up to net profit with margin and ROI. Click “More” to see the parts of each line, such as FBA fulfillment and the referral fee.
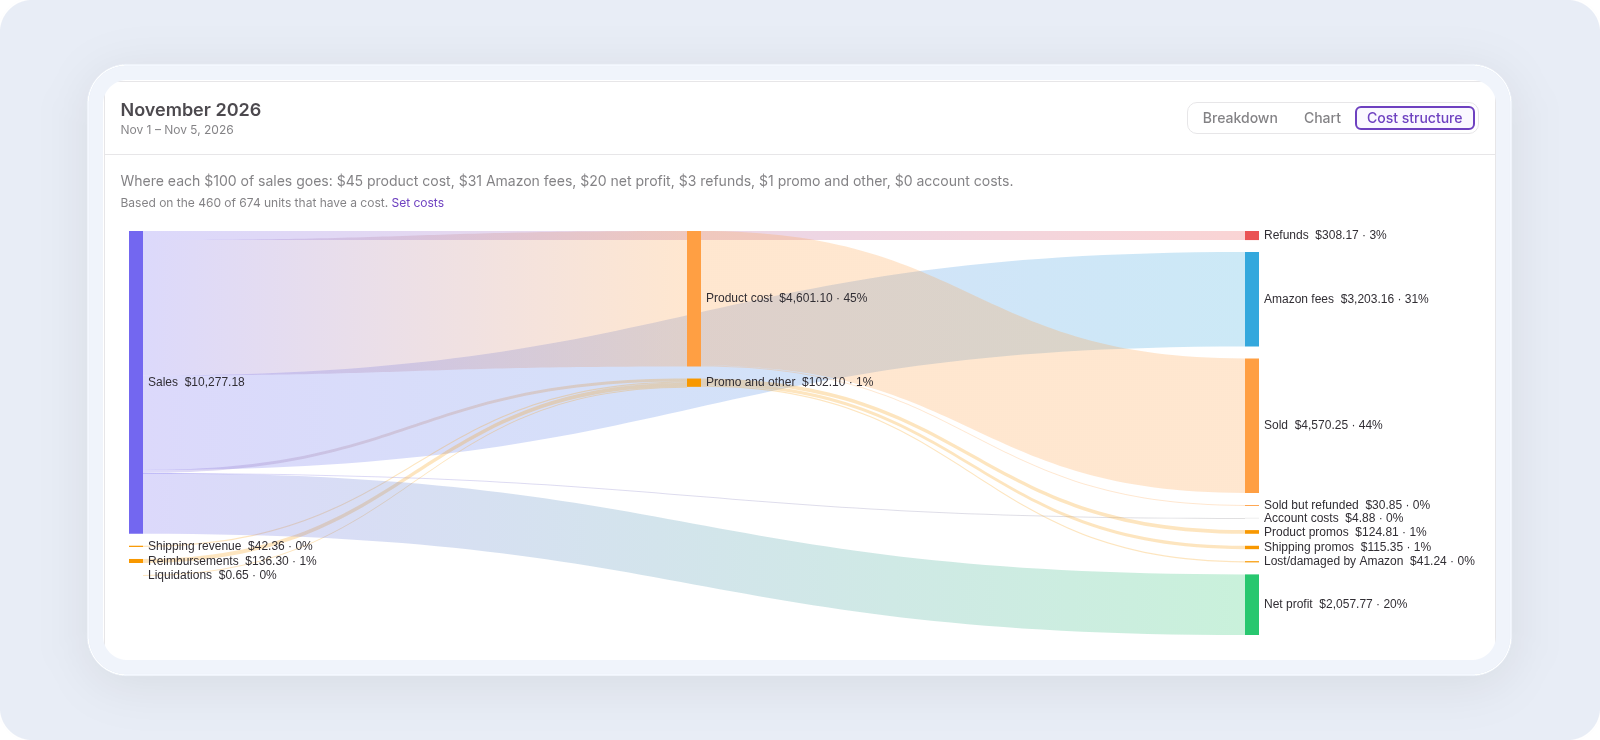
- Breakdown, Chart and Cost structure: three views under the cards. Breakdown groups the period by brand, supplier, product or SKU. Chart shows revenue, net profit, refunds and units over time. Cost structure shows where each $100 of sales goes.
- P&L and Payouts: separate pages. P&L shows weeks, months or quarters side by side, and Payouts shows Amazon’s settlements and deposits.
Profitability is an operational view for buying and reorder decisions. Its numbers won’t tie exactly to your accounting, so keep your bookkeeping separate.
Before You Start
You need two things in place before profit by SKU is reliable:
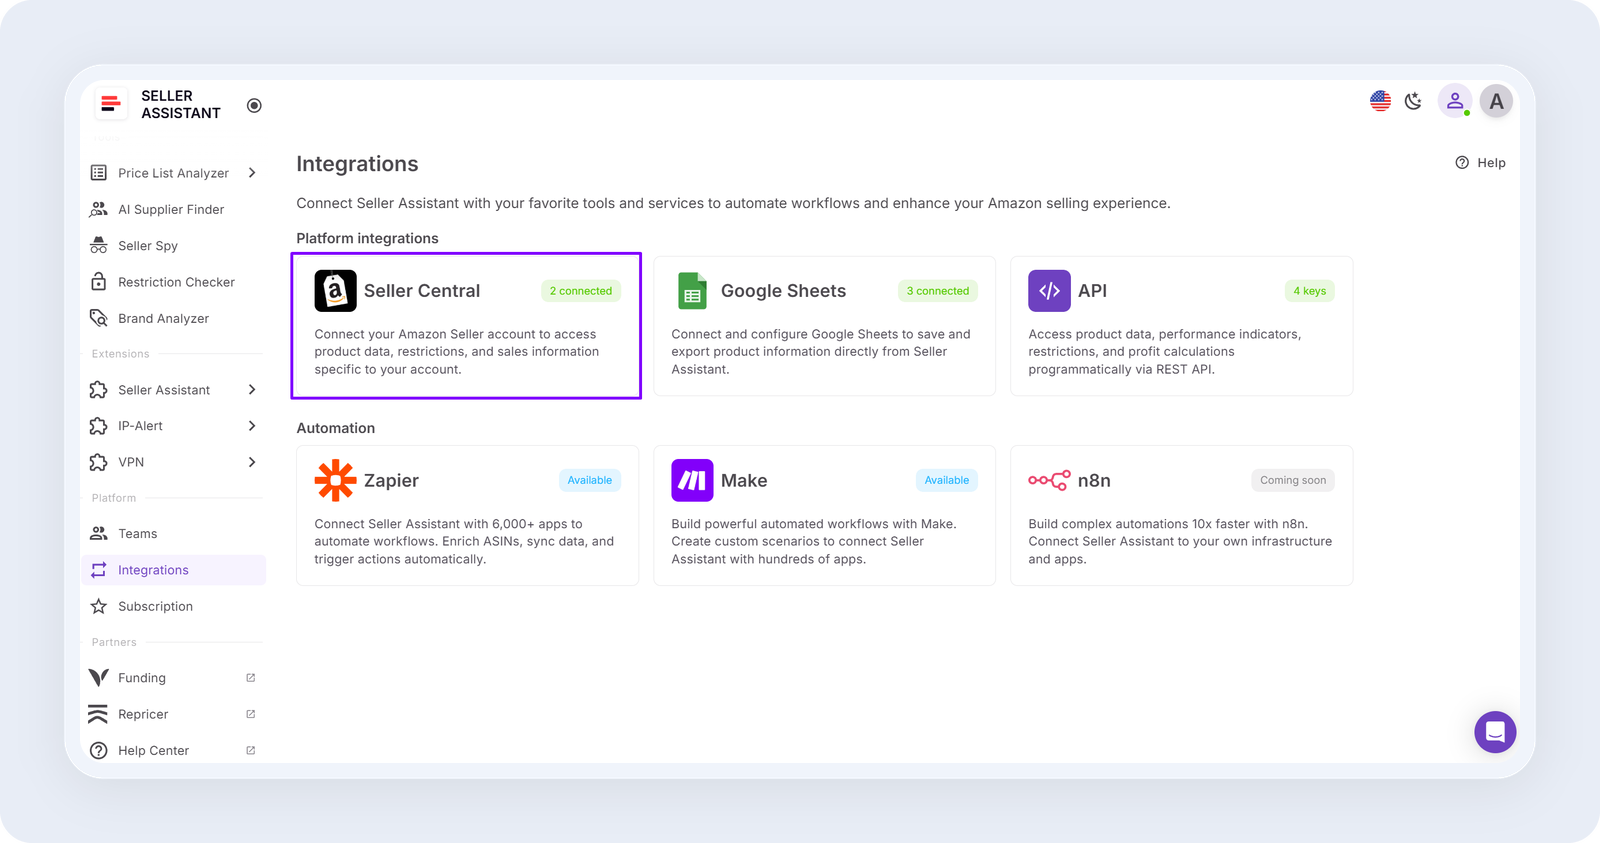
- A connected Amazon seller account. Profitability reads your orders, refunds and Amazon fees from it.
- Product costs on your SKUs. Costs come from your purchase orders, or you can import them from a file on the SKUs page. The cost of each unit is the SKU’s unit cost plus its share of the purchase order’s expenses. If you’re not sure what that should include, start with your landed cost.
Costs matter for every number below. If any unit in a row has no cost, Profitability shows a dash for product cost, net profit, margin and ROI instead of $0, so missing costs never look like pure profit.
How to See Amazon Profit by SKU, Brand and Supplier
Profitability shows the same period at every level, from all your products down to a single SKU. The seven steps below take you from the overview to the SKU table, then to reading the account costs and exporting the result, so you can see where your profit comes from.
Step 1. Open Profitability and pick the marketplace and period
Open Profitability in Seller Assistant. At the top of the page, choose what you want to see:
Scope: keep “All products” to start. Later you can narrow it to selected suppliers, brands, products or SKUs.
Marketplace: pick one, for example USA. Each marketplace shows its own currency, so totals are never mixed.
Period: choose Recent (Today, Yesterday, 7 days or 30 days), Monthly, or Custom for your own dates, which also shows the previous period for comparison.
The period and scope stay in the page URL, so you can bookmark a view and come back to it.

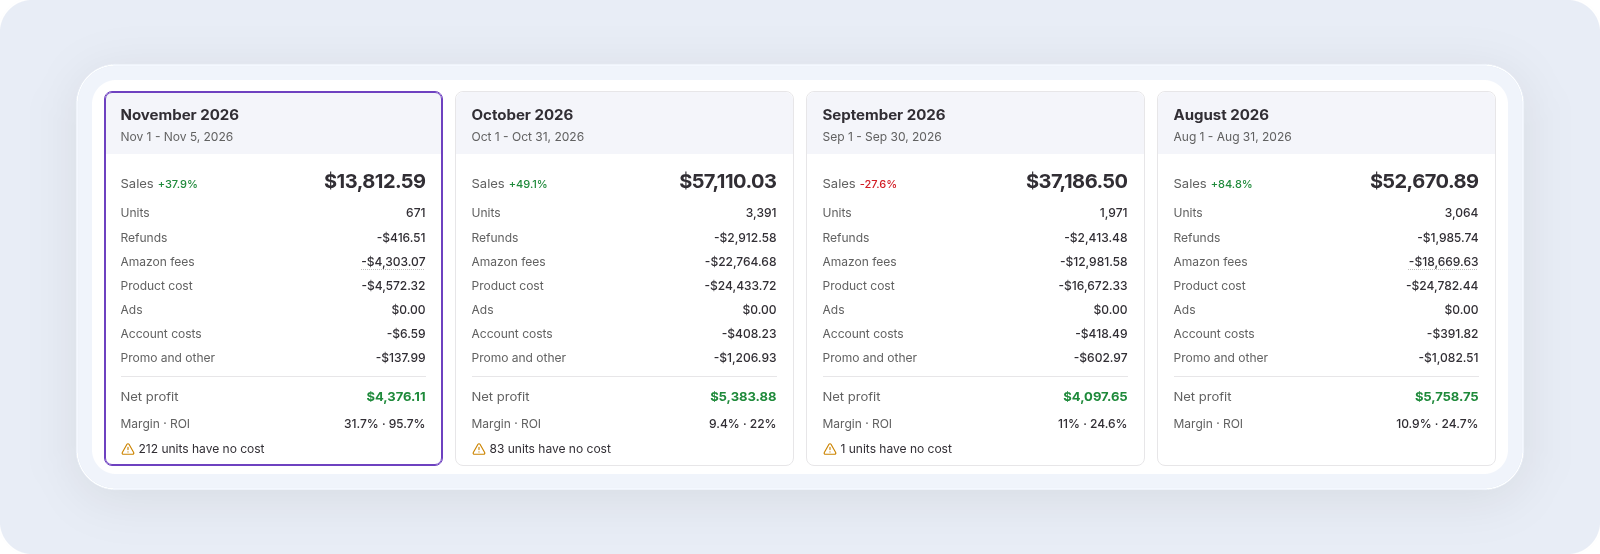
Each period card shows sales, units, refunds, Amazon fees, product cost, ads, account costs, and promo and other, adding up to net profit with margin and ROI. A period that hasn’t ended yet, like the current month, shows only the profit so far.
Step 2. Add costs for units that have none
Profit is only as accurate as your costs. When some units sold without a cost, Profitability tells you in two places:
- A warning on the period card, such as “212 units have no cost.”
- A row in Next actions, such as “282 units have no cost,” with the number of SKUs that need a cost.
Until you add those costs, profit counts only the units that have one.

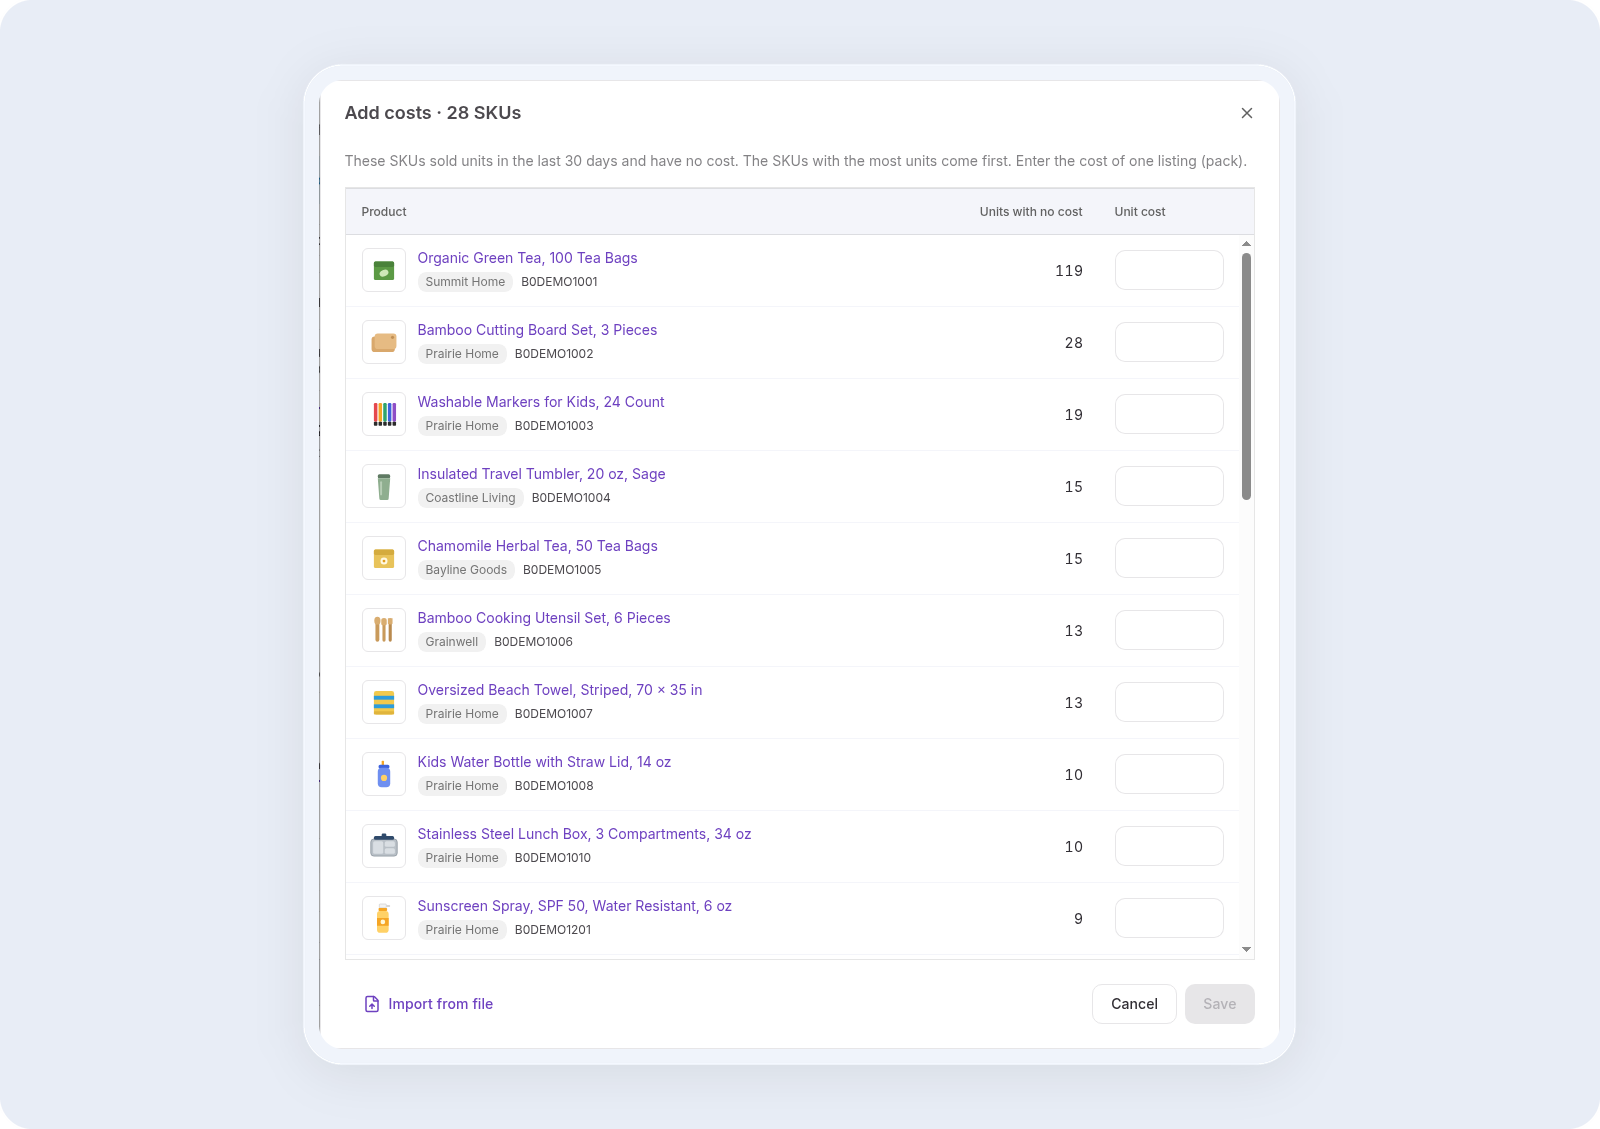
Click “Add costs” to open the dialog. It lists the SKUs that sold units with no cost in the last 30 days, up to 200, with the SKUs that sold the most units first. Enter the cost of one listing, or one pack if the SKU is a multipack, and click Save. You can undo the change if you make a mistake. When you change a cost, Profitability recalculates the orders that already used that SKU.
Other ways to add costs
The menu next to “Add costs” also lets you import costs from a file, show the SKUs without a cost, or set a reminder for later. It also has “Hand to AI,” which passes the task to an AI assistant. That option is on the Business plan and higher.
Step 3. Review profit by brand
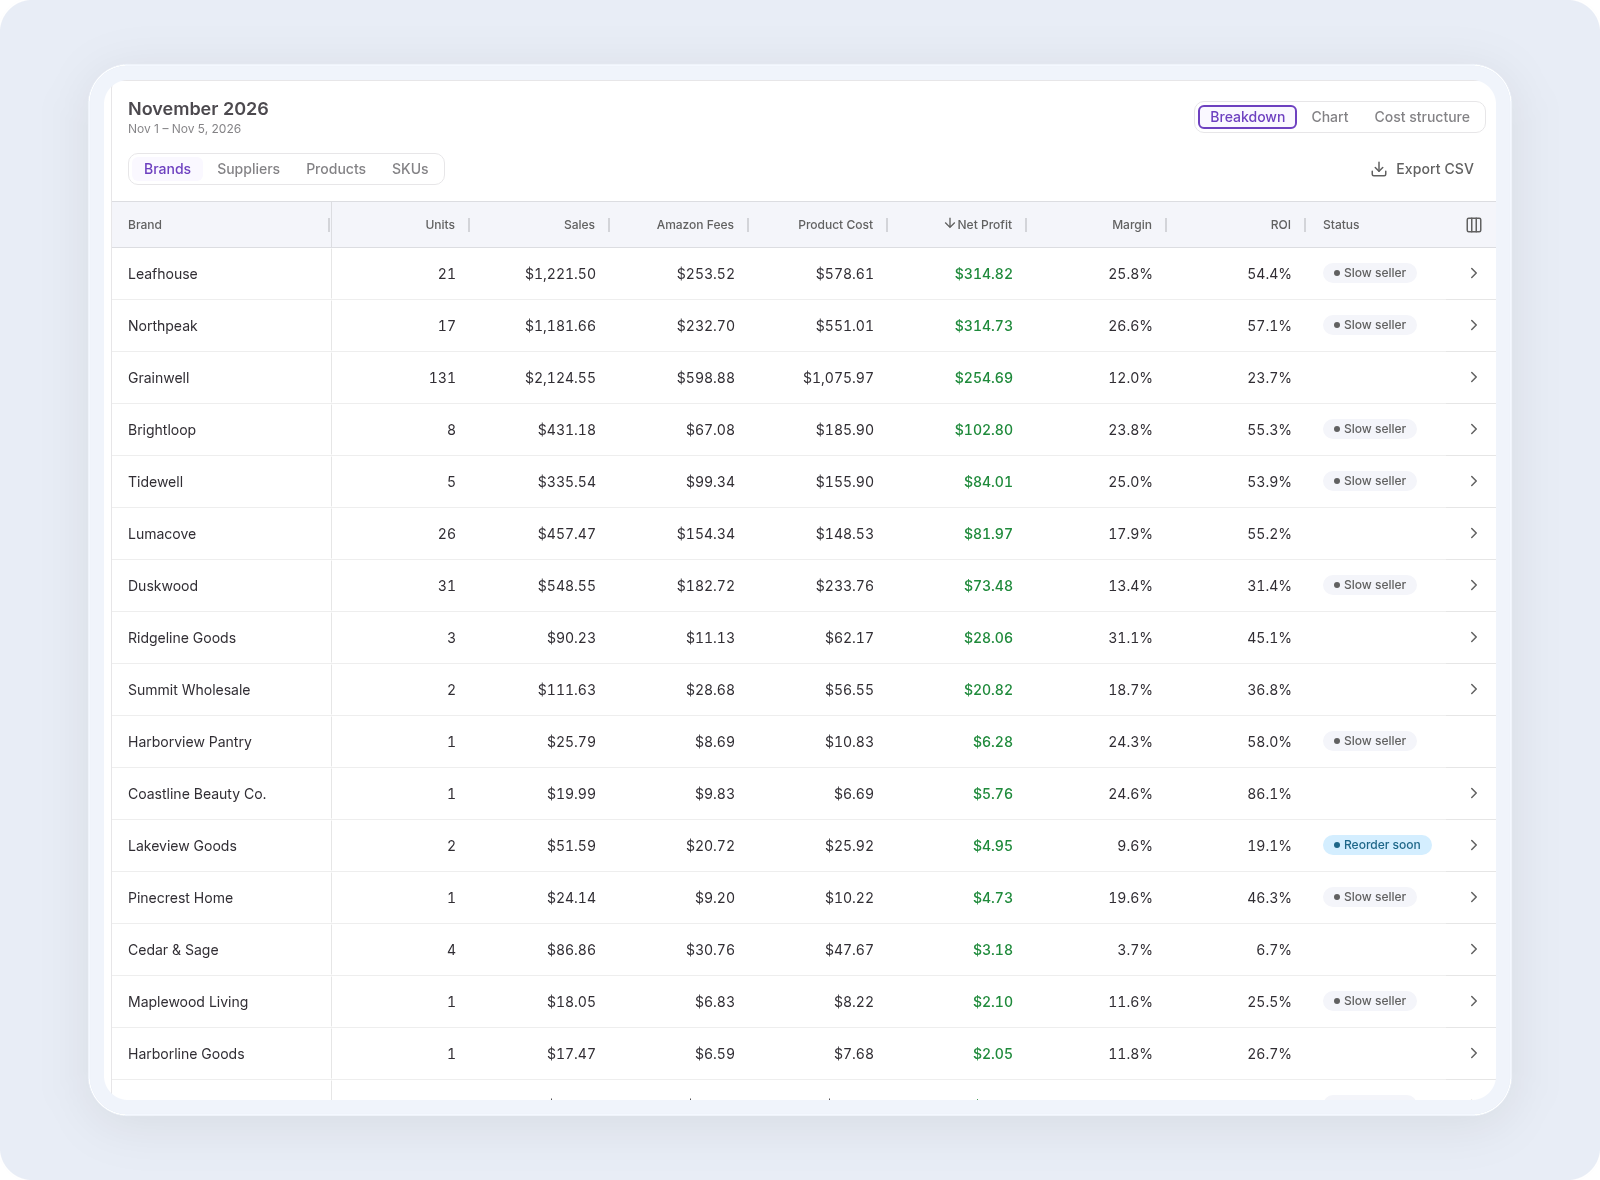
Below the period cards, the Breakdown table groups the period’s results. Brands is the default grouping, so the first view shows Amazon profit by brand: units, sales, Amazon fees, product cost, net profit, margin and ROI for each brand. Click any column header to sort, for example by Net Profit to see your strongest brands first. Some rows also carry a status label, such as “Slow seller” or “Reorder soon.”
Products without a brand appear as “Unknown brand.”
Drill down into a brand
Click a brand to narrow the page to it. The table then opens to the next level, the suppliers and products of that brand. If a level has only one item, for example a brand you buy from a single supplier, Profitability skips it and goes straight to the next level.
Step 4. Switch the grouping to Suppliers
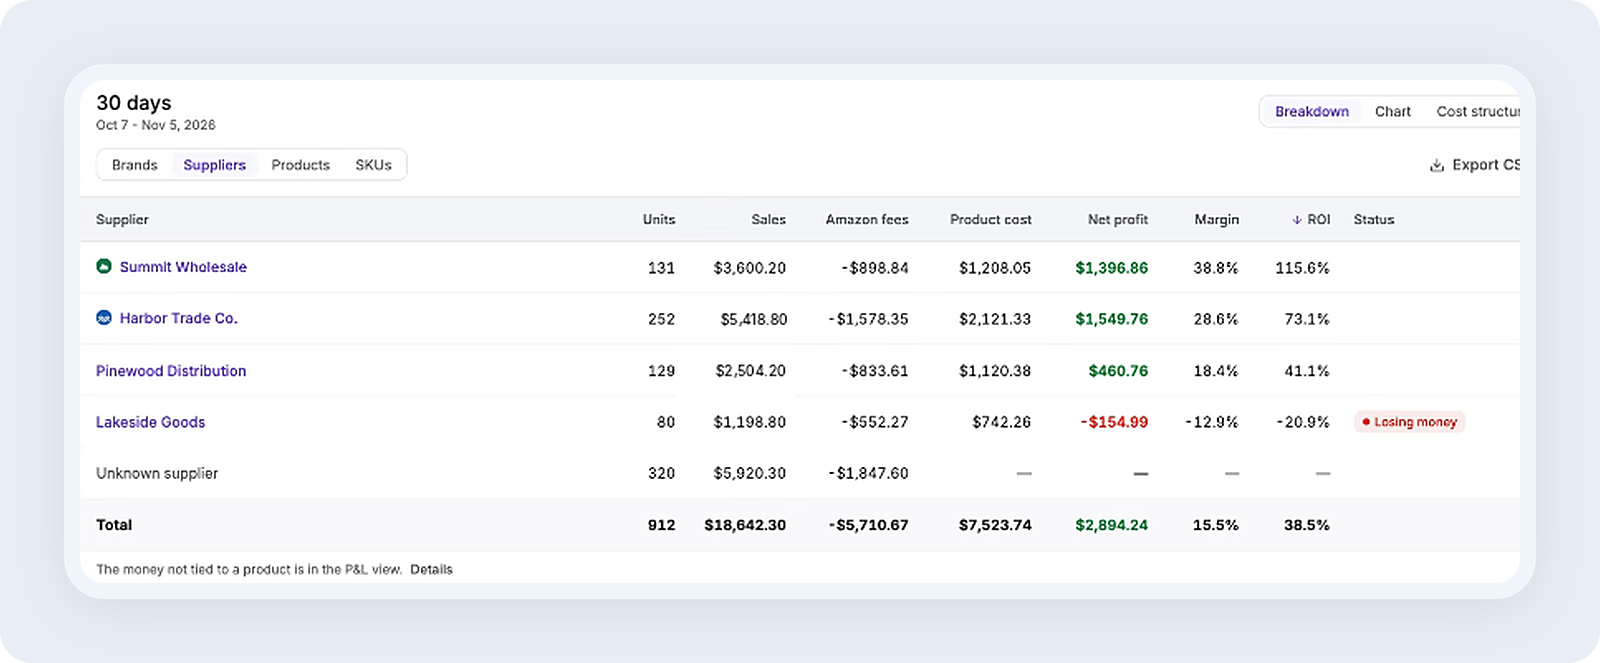
To compare Amazon profit by supplier, click Suppliers above the table. The same period is now grouped by the supplier you bought each product from, so you can see which suppliers’ products made money and which didn’t.
In the example, most suppliers are profitable, but Lakeside Goods shows a net loss of $154.99 and a “Losing money” status. That’s the supplier to look at closely before your next order.
How Profitability picks the supplier
By default, the supplier comes from the SKU’s current cost: the purchase order line it came from, or else the product’s default supplier. When neither is set, the row shows “Unknown supplier,” and its product cost, net profit, margin and ROI show dashes if its units have no cost.
If your SKUs start with a supplier code
Many wholesale sellers put a supplier code or name at the start of each SKU, such as “NP-WB32-BLK.” To group by that instead, open the settings (the gear icon next to Help) and change “Supplier in the SKU” from Off to “Supplier code at the start” or “Supplier name at the start.” The code or name must be followed by a space, a hyphen or an underscore, and match a supplier you’ve saved in Suppliers.
Step 5. Open the SKU table
Products can sell under more than one SKU, for example as a single unit and as a pack. To see SKU-level profit and loss, go one level deeper:
- From a product: on any product row, click “Show SKUs” to open that product’s SKU table.
- For all SKUs at once: click SKUs above the table to group the whole period by SKU.
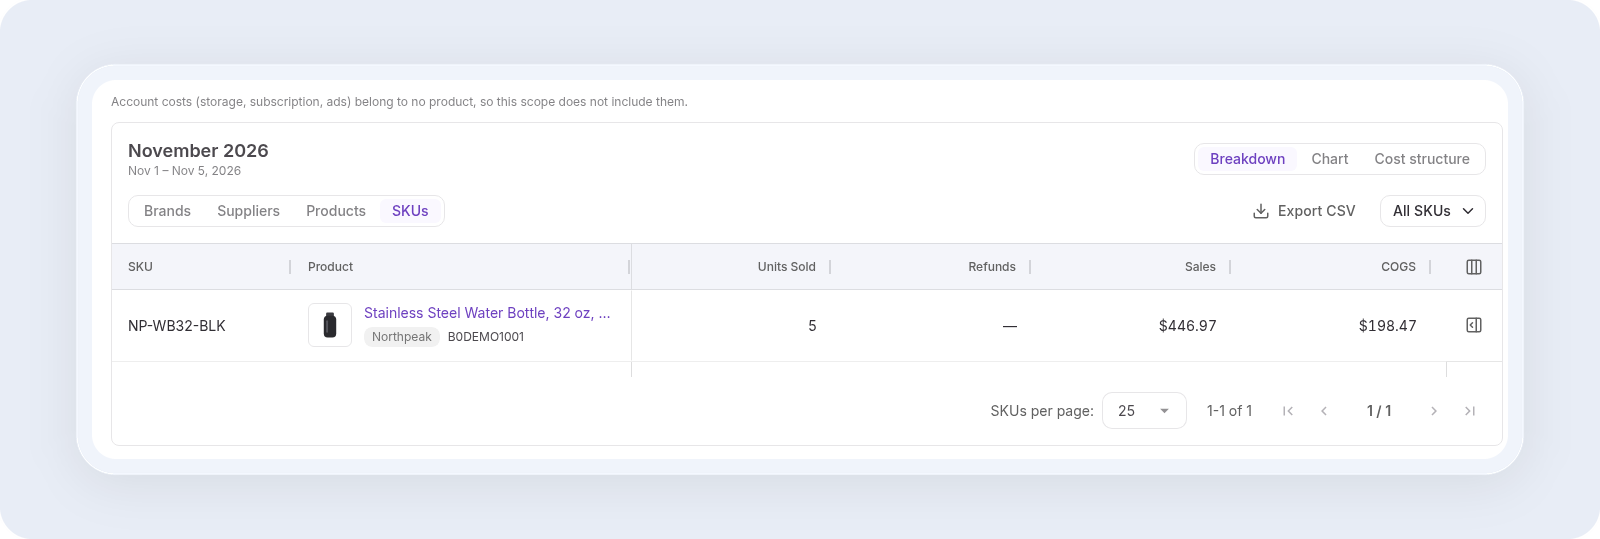
The SKU table shows each SKU with its product, units sold, refunds, sales and COGS for the period. It’s the most detailed view of Amazon SKU profitability. You can see which listing of a product earns money.
Find and check a SKU
- Search: type at least 2 letters. The search matches from the start of the product name.
- Sort by COGS, ascending: SKUs with no cost come first, so you can spot gaps fast.
- Click a SKU row: its side panel opens with the details for that SKU.
Step 6. Read the costs not tied to a product
Some Amazon costs belong to your whole account, such as storage fees, your subscription, ads and reimbursements, for example. Amazon doesn’t split these by product, so Profitability doesn’t either.
What this means for SKU profit
- On the period cards for all products, account costs are subtracted, so net profit there is your full result for the period.
- When you narrow the view to a brand, supplier, product or SKU, account costs are not subtracted. A line above the table says: “Account costs (storage, subscription, ads) belong to no product, so this scope does not include them.” You can see it in the Step 5 screenshot.
- The full amount is shown separately, under “The money not tied to a product is in the P&L view.”
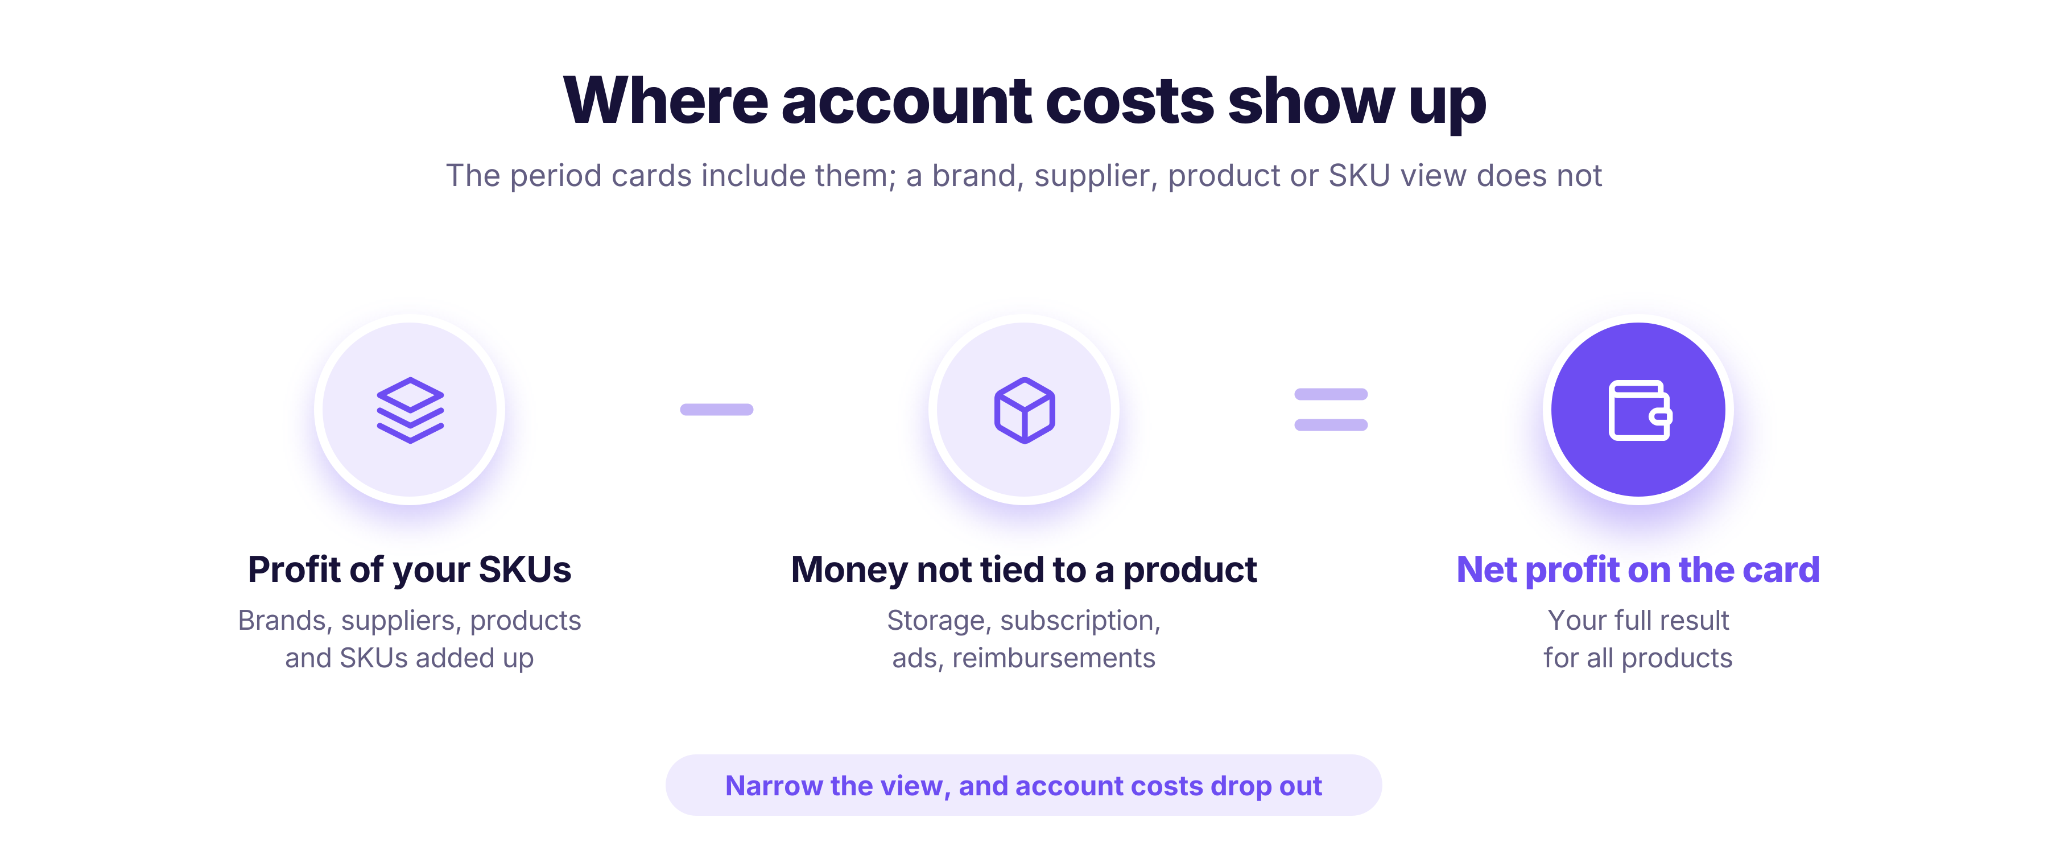
So the profits of your SKUs add up to more than the net profit on the card. A SKU with a thin margin may not cover its share of storage and ads.
Step 7. Export the table
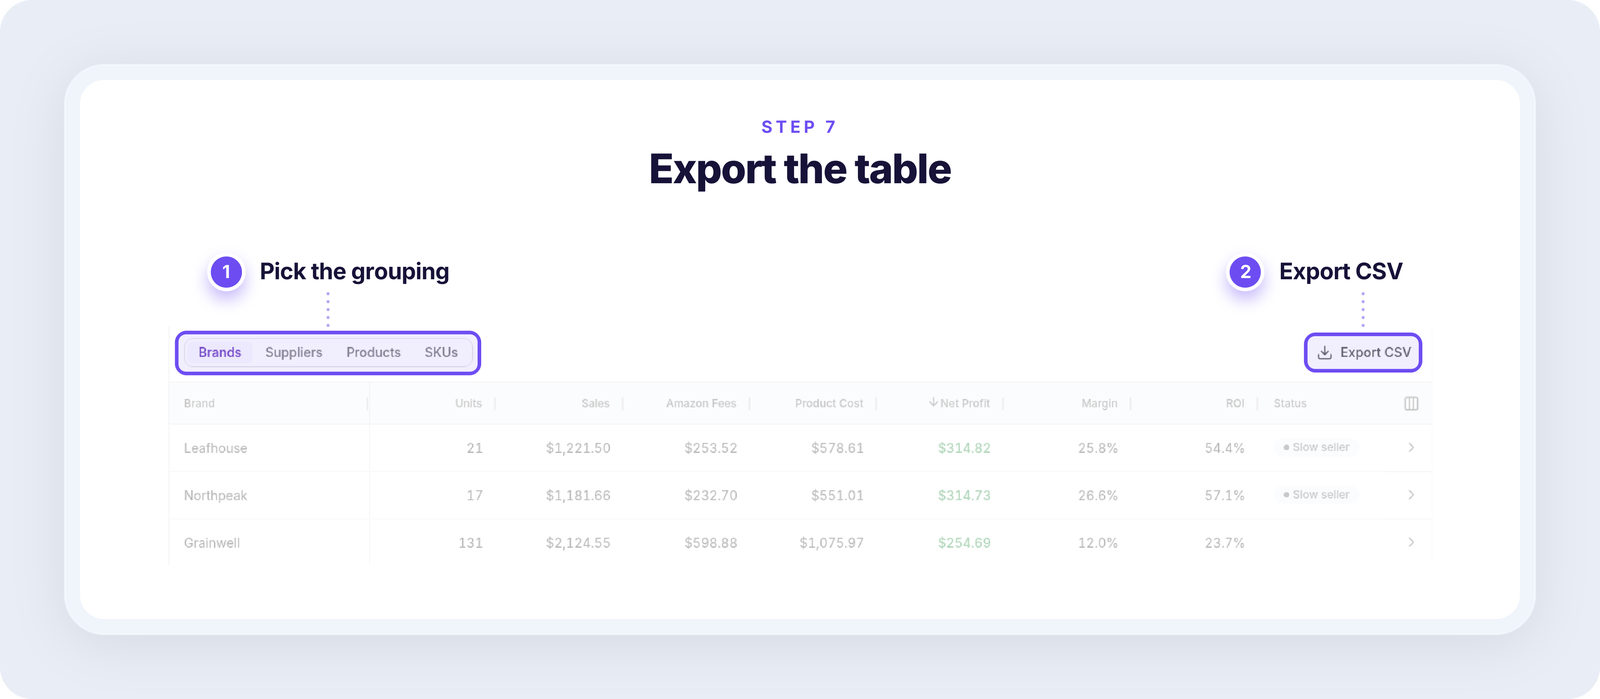
To work with the numbers outside Seller Assistant, click “Export CSV” in the top-right corner of the Breakdown table. The file contains the table you’re looking at, for the same period and grouping: brands, suppliers, products or SKUs. Open it in Excel or Google Sheets to share it with your team, or to set it next to your reorder list. You can export the P&L view the same way.
Compare the Result with What You Expected
Check profit by SKU against your plan. When you built the purchase order, you saw each product’s expected profit. Now compare it with the net profit, margin and ROI of the same SKUs made in the period.
What the comparison tells you
- Profit matches or beats the plan: a good candidate to reorder from the same supplier.
- Profit is lower than planned: check what changed. Higher fees, more refunds or a lower selling price can all eat the margin. If the price fell because more sellers joined the listing, see how to tell if you’re losing money in a price war.
- Profit is negative: don’t reorder at the old cost. Ask the supplier for a better price, or drop the SKU.
Run this check on a full period, so a few slow days don’t decide your next order.
FAQ
Why doesn’t my profit by SKU match my Amazon payout?
They follow different dates. A payout covers Amazon’s settlement period and the money sent to your bank. Profit counts sales, product cost and Amazon fees on the order date. A payout and the profit for the same calendar dates will rarely match, so compare payouts with your bank deposits and Amazon settlement reports instead.
Which date does Profitability use for sales and refunds?
Sales, product cost and Amazon fees count on the order date, in the marketplace’s local time. Refunds count on the refund date by default. You can switch them to the order date in the settings, and Profitability then recalculates your history. Ads, account costs and reimbursements count on the date Amazon posted them.
Where does a SKU’s product cost come from?
From your purchase orders: the exact purchase order the units came from, or else a weighted average of your completed orders. A cost you enter by hand or import from a file takes priority over both.
Why do some products show as “Unknown supplier”?
Add costs to those SKUs through a purchase order, or set a default supplier on the product. Profitability then takes the supplier from there.
Can I use Profitability for bookkeeping or taxes?
Profitability numbers won’t tie exactly to your books, so use your accounting software or accountant for bookkeeping and taxes. To reconcile with Amazon, use the Payouts page and your settlement reports.
Key Takeaways
Profit by SKU shows which products, brands and suppliers made money after the sale.
- Start with the costs. Add costs for every unit that has none. Until you do, those rows show a dash, and net profit counts only the units with a cost.
- Drill down from brand to SKU. Group the period by brand, then by supplier, then open the SKU table to see which listing of a product earns money.
- Remember the account costs. Brand, supplier, product and SKU views leave out storage, subscription, ads and reimbursements. The net profit on the period card for all products includes them.
- Check full periods. A month that hasn’t ended shows only the profit so far, so base reorder decisions on complete periods.
- Compare with your plan. Set each SKU’s real profit against the expected profit of its purchase order before you reorder from that supplier.